Select units of measurement for the temperature and rainfall tables (metric or imperial).
Average weather, temperature, rainfall, sunshine
Most of South Africa is covered by a
plateau, which has a
subtropical climate, with dry, sunny winters, during which it can get cold at night, and hot summers, during which thunderstorms can break out. The plateau is
arid in the western part, where there is a desert, and
moderately rainy in the eastern one, where there are several cities including Johannesburg and Pretoria.
On the
western coast, on the other hand, occupied by the Namib desert, we have a cool and arid climate.
On the
southern and eastern coasts, the climate takes on Mediterranean characteristics, i.e. with mild, rainy winters and warm, sunny summers, in the western part (see Cape Town), while in the eastern part (see Durban), summer is the rainy season.
The Republic of South Africa, the southernmost African country, extends from 22° to 34° south latitude. Being in the Southern Hemisphere, it has seasons reversed compared to Europe or North America.
Index
West Coast

The
west coast of South Africa is affected by the
Benguela Current, which cools the sea and makes the
climate arid, since it inhibits the formation of vertical air currents that could condense. However, the cold current also causes the formation of fog, mist and low clouds, especially in the morning. We are in the southern part of the Namib Desert, where the rains are rare and sporadic. In this part of the country there are no major cities.
Here, the climate is
constantly mild, with average daytime temperatures around 16 °C (61 °F) in winter and around 20 °C (68 °F) in summer, even though rapid increases in temperature may occur when the wind blows from the desert, which lies to the east and is scorchingly hot in summer. However, due to
fog, humidity and wind, you can feel cold, especially in winter.
As mentioned, the climate along the west coast of South Africa is very arid. In
Alexander Bay, located in the northern part of the coast, on the border with Namibia, rainfall even drops below 50 mm (2 in) per year.
In
Port Nolloth, in the northern part of the coast, the average temperature ranges from 14.5 °C (58 °F) in August to 18 °C (64.5 °F) in January and February.
In Port Nolloth, just 70 mm (2.75 in) of rain fall per year.
The sea is cold all year round.
South and East Coast

On the south and east coast, there is a
subtropical climate, and above all, warmer and rainier than on the west coast. For this reason, there are important cities such as Cape Town, Port Elizabeth, East London, and Durban.
In the southwestern part of the coast, there is a
Mediterranean climate, with mild, rainy winters and warm, sunny summers.
In
Cape Town, the average temperature ranges from 13 °C (55 °F) in July to 22 °C (72 °F) in January and February.
In Cape Town, 505 millimeters (20 inches) of rain fall per year, with a maximum in late autumn and winter, from May to August.
The temperature of the
sea in the area of Cape Town is never warm, however, it is slightly milder in the sheltered False Bay, east of Cape of Good Hope, than along the Atlantic coast to the west. In fact, in False Bay, the water temperature reaches 20 °C (68 °F) in January and February and drops to 16 °C (61 °F) in winter, while in Cape Town, it never reaches 20 °C (68 °F), so it's a bit cold even in summer.
The cities situated at the foot of the mountains, east of Cape Town, are rainier. In
Stellenbosch, rainfall reaches 930 mm (36.5 in) per year, though it still follows the Mediterranean pattern, ie with a dry summer, which here is a little warmer because of the greater distance from the sea.
Cape Agulhas, which separates by convention the Atlantic from the Indian Ocean, is windy and overlooks a perilous sea, frequently rough and crossed by strong currents. To tell the truth, the
Cape of Good Hope is not very calm as well, as evidenced by the name originally given by its discoverer, Bartolomeu Dias, who named it "Cape of Storms".

The thin coastal strip to the east of the Cape Town area is characterized by a very mild climate, which becomes progressively warmer and rainier as we move towards the east-northeast.
In the
southern belt (the area circled in blue on the map), the climate is transitional between the Mediterranean and the warm oceanic one: it is mild or pleasantly warm and breezy, with limited variations in temperature between winter and summer; rainfall is not abundant, but it's well distributed throughout the year, with only a slight decrease in summer.
In this area, along the road called
Garden Route, there are the cities of
Mossel Bay,
George and
Plettenberg Bay.
More to the east, in
Gqeberha (formerly Port Elizabeth), temperatures are similar to those in Cape Town, albeit a bit milder.
In winter, temperatures are spring-like, since the average in July is 14.5 °C (58 °F), although short cold waves from Antarctica can occasionally lower the night-time temperature to around freezing (0 °C or 32 °F) between June and September.
Summer is pleasant, since the average in January and February is 22 °C (72 °F), with a lively and constant breeze from the sea.
Throughout the year, every now and then, hot and dry winds can blow from the mountains, which lie a short distance from the coast.
In Gqeberha, 630 mm (24.8 in) of rain fall per year. The rains are better distributed than in Cape Town, in fact it can sometimes rain even in summer.
Unlike in Cape Town, the sea in Port Elizabeth is never very cold, and it is warm enough for swimming from December to April.
In the
eastern part of the coast, ie the area circled in burgundy, the climate is warmer, with more abundant rainfall in the warm season, so it can be defined as humid subtropical.
In
East London, the temperatures are similar to those of Port Elizabeth, but winter is a bit milder. Rainfall is more abundant, around 800 mm (31.5 in) per year, with and evident increase in the period from October to March, when the air is a bit muggy, even though the temperatures are usually not so high; on the other hand, winter is the least rainy season.
Continuing north-east, on the coast of KwaZulu-Natal, in
Durban it gets quite hot and humid in summer: the average in January and February is around 25 °C (77 °F), and the humidity makes the heat muggy, even though the breezes blow in the afternoon, giving a bit of relief. In addition, thunderstorms may occur in the afternoon or in the evening, giving some additional relief (or maybe, disturbing those who are on the beach).
In winter, the driest and sunniest season, daytime temperatures are very pleasant, on average around 24/25 °C (75/77 °F), however, sometimes it can get a bit cold, especially at night.
Here, about 1,000 mm (40 in) of rain fall per year, of which more than 100 mm (4 in) fall per month from November to March, while in winter, from June to August, it doesn't rain much.
At this latitude, the temperature of the
sea exceeds 23 °C (73 °F) from November to May, and after all it's not so bad even in winter, since it does not drop below 22 °C (72 °F).
Plateau

As previously mentioned, much of South Africa is occupied by a plateau.
The temperature varies with altitude, however, the daily temperature range is generally high.
Winter is dry and sunny. Winter nights are cold, and from May to August, the temperature can drop below freezing after
cold air outbreaks of Antarctic origin, especially in the central-southern part.
The sun also shines in
summer, but thunderstorms can break out in this season, especially in the eastern part and at higher altitudes. Summer days can be
scorchingly hot, in particular from October to March.
The western part of the plateau is drier, and often even warmer, as the altitude is typically lower than 1,200 meters (3,900 feet).
In
Upington, located in the western part of the plateau, not far from the borders with Namibia and Botswana, and 835 meters (2,750 feet) above sea level, the average temperature ranges from 13.4 (56 °F) °C in July to 29 °C (84 °F) in January. Here, the temperature reached 44.6 °C (112.3 °F) in January 2012, and 45.3 °C (113.5 °F) in January 2016.
The scarce rains, which occur in winter along the west coast, in inland areas occur in summer, in the form of afternoon showers.
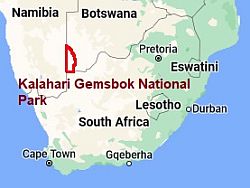 Kalahari Gemsbok, where is located
In the Kalahari Gemsbok National Park, which is the South African part of the Kgalagadi Transfrontier Park, on the border with Botswana and Namibia, there is a dry savannah landscape, but also sand dunes: we are in the southern part of the
Kalahari Desert.
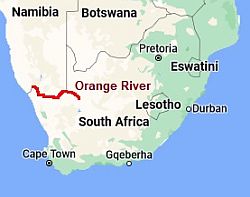 Lower course of the Orange River
Although most of the interior is occupied by a plateau, there is also a small lowland area, in particular, the lower
Orange River valley, on the border with Namibia, where about 200 km (125 mi) from the coast, the altitude is already around 300 meters (1,000 feet). Southwest of Upington, the Augrabies Falls, 600 meters (2,000 feet) above sea level, are considered
the hottest place in South Africa: here, the temperature reached 48.6 °C (119.5 °F) in January 2016, and 46.1 °C (115 °F) in 2015. Further to the west, in Vioolsdrif, at a lower altitude but closer to the sea, the heat record is 47 °C (116.5 °F).

Returning to the plateau, in
Calvinia, further south and at 1,000 meters (3,300 feet) above sea level, the average temperatures are lower than in Upington. In Calvinia, the temperature can reach 40 °C (104 °F) from November to March, while at night it can drop to -5 °C (23 °F) from May to August.
The
coldest area of the plateau is the southern one, called Great Karoo, being more exposed to outbreaks of polar air masses in the winter months. Above 1,000 meters (3,300 feet), the temperature can drop below -10 °C (14 °F).
A particularly cold city is
Sutherland, located at 1,450 meters (4,700 feet) above sea level. Here, the average temperature ranges from 6 °C (43 °F) in July to 20.5 °C (69 °F) in January. The coldest record, set in July 2003, is as low as -16 °C (3 °F). Precipitation amounts to 245 mm (9.5 in) per year.
In the
central and eastern part of the plateau, the rains are more abundant, especially in the warm season, when humid currents from the Indian Ocean prevail.
Johannesburg, the largest city of the country, is located at 1,700 meters (5,600 ft) above sea level, in the plateau called
Highveld, and thanks to the altitude, it has a
pleasant and sunny climate.
In the warm season, from October to March, it's hot during the day, with possible thunderstorms in the afternoon or in the evening, while nights are cool.
Winter, from May to August, is dry and sunny, with very cool or even cold nights, while temperatures become usually mild during the day. Sometimes at night, the temperature can drop below freezing, especially in June and July.
A few times over the last century, even snowfalls have occurred, in the period from June to August. Throughout the year, 705 mm (27.8 in) of rain fall on average, of which approximately 90/120 mm (3.5/4.7 in) fall per month from November to March.

North-west of Johannesburg lies the UNESCO World Heritage Site called "Cradle of Humankind", where ancient fossils of
Australopithecus Africanus have been found.
North of Johannesburg, we find
Pretoria, which is located at a slightly lower altitude, ie at 1,300 meters (4,250 feet), so it has a similar climate, just slightly warmer than in Johannesburg.
Kimberley, the capital of the Northern Cape Province, located at 1,200 meters (3,900 feet) above sea level, is characterized by
very hot summers, and by lower rainfall than in Johannesburg, around 435 mm (17 in) per year. However, here too, rainfall is more likely from November to April. The rainiest months are February and March.
From May to September, however, given the southern position, the city is more exposed to
cold winds and more prone to night frosts than Johannesburg, although during the day the temperature remains mild.
Bloemfontein, located at 1,400 meters (4,600 feet), south-east of Kimberley, is slightly cooler. Here, night frosts from June to August are frequent, but during the day, the air is usually mild and the sun shines.
Near the southern and eastern margins of the plateau, there are several
mountain ranges, with peaks often exceeding 2,000 meters (6,500 feet). The most imposing range is
Drakensberg, whose highest peak, 3,482 meters (11,424 feet) high, however, is located in Lesotho. Above 2,500 meters (8,200 ft), it can snow from June to August. Along the eastern escarpment, in the provinces of Eastern Cape, Kwa-Zulu Natal and Mpumalanga, the summer rains are plentiful, exceeding 100 mm (4 in) per month, and the total annual can reach 1,000 mm (40 in).
North-east

The far north-east of South Africa has a warmer climate than the plateau, both because of the lower latitude (it is located at the Tropic of Capricorn) and because of the lower altitude, which descends below 1,000 meters (3,300 feet) above sea level.
Kruger National Park
The
Kruger National Park, where you can find elephants, lions and other animals of the savannah, is located on the border with Mozambique, mostly at an altitude ranging from 300 to 500 meters (1,000 and 1,600 feet). Here the winter is dry and sunny, with large temperature variations between night and day: at night, it can get cold, about 10 °C (50 °F) or less, while during the day the temperature gets warm, around 26/27 °C (79/81 °F). Therefore, when going on safaris in this period, it's better to dress in layers. Summer is hot and humid, with possible afternoon thunderstorms.
In
Skukuza, the main camp of the park, located at 270 meters (890 feet) above sea level, at the lowest point of the park, the average temperature ranges from 16.6 °C (61.9 °F) in June and July to 26.9 °C (80.4 °F) in February.
In the Kruger National Park, the rains, scarce in winter, become relatively abundant in summer because of afternoon thunderstorms.

The
northernmost area, along the
Limpopo River, on the border with Zimbabwe, is particularly dry, and here the days are very hot, especially from November to February, when there is also some chance of showers in the afternoon, usually not heavy. Here, we find the
Musina Nature Reserve and the
Mapungubwe National Park (formerly Vhembe Dongola National Park), both home to a large number of huge baobab trees as well as animals such as giraffes, antelopes and zebras.
Cyclones
The north-east coast of South Africa, north of Durban, where cities such as Richards Bay and St Lucia are found (but sometimes Durban too, as happened with tropical storm Irina in March 2012), sometimes can be brushed by
tropical cyclones, which form in the Indian Ocean from November to mid-May (but most likely from
late December to mid-April) and usually hit the coast of neighbouring Mozambique, or they can sometimes follow a more southern path, dissipating in the ocean. Although after Tropical Storm Domoina in late January 1984, no cyclone has directly hit the coast of South Africa, the effects in terms of rains, strong winds and storm surges can be felt also at some distance.
Cyclones can also affect the far north-east, in the provinces of Limpopo and Mpumalanga, after passing over the coast of Mozambique. In general, Mozambique takes the brunt of the damage, but in inland South Africa, including the Kruger Park, there may still be heavy rains, as happened with Cyclone Eline in February 2000. This is one more reason to avoid the austral summer, in addition to the hot and humid weather, which in any case is typical of this period.
When to go
Since it has different climates, it's hard to find a single time that is best the whole South Africa.
A good compromise between the different areas can be found in spring, in
September and October, in order to avoid the winter cold of mountains and plateaus, the summer heat of inland areas, and the summer rains of the east, as well as the tropical cyclones that may affect the eastern regions in summer and autumn.
The austral winter,
from June to August, is the best time in the north east, where Kruger National Park is located, because you can avoid both the rains and the heat of summer: however, it's better to be adequately covered in the coldest hours. In September and October, it's already hot during the day, sometimes very hot, but nights are pleasantly cool. In this period, the cold can at times be intense especially in the highlands of the center and south, in addition, there will be some rains in the area of Cape Town, and a bit of wind along the southern coast, but after all, even the austral winter is an acceptable period. If the weather conditions are good, it will also be possible to swim in the sea in Durban and on the north-eastern coast.
The austral summer,
from December to February, is the best time on the west and south coasts (see Cape Town, Port Elizabeth), but also in the higher mountains. Instead, in inland areas it is very hot, especially at low altitudes, moreover, in the eastern part it is the rainiest season of the year, and in the north-east, sometimes even tropical cyclones can pass.
Having a good climate,
Johannesburg can be visited throughout the year, perhaps excluding June, July and early August because of the risk of cold weather. The best month is probably September, in fact it is mild, sunny and with little rain. April and October, though a little more rainy, are fine too.
As previously mentioned, the
sea is cold along the Atlantic coast, and becomes gradually milder as we proceed from the south coast towards the east.
What to pack
In
winter (June to August): for the western and southern coasts, up to Port Elizabeth, bring spring/autumn clothes, a sweatshirt or sweater and jacket, and a raincoat or umbrella.
For the north-east coast (see Durban), bring spring/autumn clothes, a sweater and a jacket.
For the central plateau (Kimberley, Johannesburg), bring spring/autumn clothes for the day, but also a sweater and a warm jacket for the evening; for the southern part of the plateau and at higher altitudes (see Sutherland, De Aar, Bethlehem, Bloemfontein), warm clothes, such as a down jacket, gloves, a scarf, and a hat for the evening.
For the north-east (Messina, Kruger Park) and the Kalahari, bring spring/autumn clothes (light for the day), a sweater and a warm jacket for the evening. A windbreaker for off-road safaris.
In
summer (December to February): for the west coast north of Cape Town, bring spring/autumn clothes, a sweatshirt and a light jacket.
For the south coast, from Cape Town to East London, light clothing, a sweater and a light jacket for the evening, and a scarf for the breeze; for the north-east coast (see Durban), light clothing, a light sweatshirt, and an umbrella or a light raincoat.
For the central plateau (Kimberley, Johannesburg), light clothes for the day, a sweatshirt or sweater and a light jacket for the evening, a sun hat, and a light raincoat or umbrella; for the southern part of the plateau and at higher altitudes (see Sutherland, De Aar, Bethlehem, Bloemfontein), a sweater, and a spring jacket for the evening.
For the north-east (Messina, Kruger Park) and the Kalahari, very light clothes, of natural fabrics, a sun hat, a light raincoat, and a sweatshirt for the evening.
Climate data - South Africa
| Alexander Bay |
|---|
|
| Jan | Feb | Mar | Apr | May | Jun | Jul | Aug | Sep | Oct | Nov | Dec |
|---|
| Min temp. | 16 | 16 | 15 | 13 | 11 | 10 | 9 | 9 | 10 | 12 | 13 | 15 |
|---|
| Max temp. | 25 | 25 | 26 | 25 | 24 | 23 | 23 | 22 | 22 | 23 | 24 | 24 |
|---|
| Precip. | 0 | 0 | 0 | 5 | 5 | 10 | 5 | 5 | 5 | 0 | 0 | 0 |
|---|
| Prec. days | 0 | 0 | 1 | 1 | 1 | 2 | 2 | 2 | 1 | 1 | 0 | 0 |
|---|
| Humidity | 75% | 76% | 75% | 73% | 73% | 68% | 66% | 69% | 70% | 73% | 73% | 75% |
|---|
| Day length | 14 | 13 | 12 | 11 | 11 | 10 | 10 | 11 | 12 | 13 | 14 | 14 |
|---|
| Sun hours | 10 | 10 | 9 | 8 | 8 | 8 | 8 | 8 | 9 | 9 | 10 | 10 |
|---|
| Sea temp | 18 | 18 | 17 | 16 | 16 | 15 | 14 | 14 | 14 | 15 | 16 | 18 |
|---|
| Calvinia (1,000 meters) |
|---|
|
| Jan | Feb | Mar | Apr | May | Jun | Jul | Aug | Sep | Oct | Nov | Dec |
|---|
| Min temp. | 14 | 14 | 12 | 9 | 6 | 4 | 3 | 3 | 5 | 8 | 10 | 12 |
|---|
| Max temp. | 33 | 33 | 31 | 27 | 23 | 19 | 19 | 20 | 23 | 27 | 29 | 32 |
|---|
| Precip. | 30 | 25 | 25 | 20 | 10 | 0 | 0 | 5 | 10 | 20 | 25 | 30 |
|---|
| Prec. days | 1 | 1 | 3 | 4 | 3 | 4 | 4 | 4 | 4 | 3 | 2 | 2 |
|---|
| Humidity | 35% | 36% | 39% | 44% | 50% | 55% | 53% | 53% | 45% | 37% | 37% | 36% |
|---|
| Day length | 14 | 13 | 12 | 11 | 10 | 10 | 10 | 11 | 12 | 13 | 14 | 14 |
|---|
| Sun hours | 12 | 11 | 10 | 9 | 7 | 6 | 7 | 8 | 9 | 10 | 11 | 12 |
|---|
|
| Cape Town |
|---|
|
| Jan | Feb | Mar | Apr | May | Jun | Jul | Aug | Sep | Oct | Nov | Dec |
|---|
| Min temp. | 17 | 16 | 15 | 12 | 10 | 8 | 7 | 8 | 9 | 11 | 13 | 15 |
|---|
| Max temp. | 28 | 28 | 27 | 25 | 22 | 19 | 19 | 19 | 21 | 23 | 25 | 27 |
|---|
| Precip. | 10 | 10 | 15 | 45 | 85 | 80 | 85 | 70 | 45 | 30 | 15 | 10 |
|---|
| Prec. days | 2 | 2 | 3 | 6 | 9 | 9 | 10 | 10 | 7 | 5 | 3 | 2 |
|---|
| Humidity | 66% | 67% | 69% | 72% | 77% | 77% | 76% | 76% | 73% | 68% | 66% | 65% |
|---|
| Day length | 14 | 13 | 12 | 11 | 10 | 10 | 10 | 11 | 12 | 13 | 14 | 14 |
|---|
| Sun hours | 11 | 11 | 9 | 8 | 7 | 6 | 6 | 7 | 8 | 9 | 10 | 11 |
|---|
| Sea temp | 19 | 19 | 19 | 17 | 16 | 16 | 15 | 15 | 15 | 16 | 17 | 18 |
|---|
| Durban |
|---|
|
| Jan | Feb | Mar | Apr | May | Jun | Jul | Aug | Sep | Oct | Nov | Dec |
|---|
| Min temp. | 21 | 21 | 20 | 18 | 14 | 11 | 11 | 13 | 15 | 17 | 18 | 20 |
|---|
| Max temp. | 29 | 30 | 29 | 27 | 26 | 25 | 24 | 24 | 25 | 25 | 27 | 28 |
|---|
| Precip. | 120 | 130 | 115 | 90 | 60 | 35 | 25 | 40 | 65 | 85 | 120 | 125 |
|---|
| Prec. days | 11 | 9 | 9 | 7 | 4 | 3 | 3 | 4 | 6 | 10 | 11 | 12 |
|---|
| Humidity | 77% | 77% | 76% | 74% | 71% | 65% | 65% | 69% | 74% | 76% | 77% | 77% |
|---|
| Day length | 14 | 13 | 12 | 11 | 11 | 10 | 10 | 11 | 12 | 13 | 14 | 14 |
|---|
| Sun hours | 6 | 6 | 7 | 7 | 7 | 8 | 7 | 7 | 6 | 5 | 6 | 6 |
|---|
| Sea temp | 26 | 27 | 26 | 26 | 24 | 23 | 22 | 22 | 22 | 23 | 24 | 25 |
|---|
| Johannesburg (1,700 meters) |
|---|
|
| Jan | Feb | Mar | Apr | May | Jun | Jul | Aug | Sep | Oct | Nov | Dec |
|---|
| Min temp. | 15 | 14 | 13 | 10 | 7 | 4 | 4 | 6 | 9 | 11 | 13 | 14 |
|---|
| Max temp. | 26 | 26 | 25 | 23 | 20 | 18 | 18 | 21 | 25 | 26 | 26 | 26 |
|---|
| Precip. | 125 | 90 | 90 | 50 | 15 | 10 | 5 | 5 | 25 | 75 | 110 | 105 |
|---|
| Prec. days | 14 | 10 | 11 | 8 | 3 | 2 | 1 | 2 | 4 | 9 | 13 | 14 |
|---|
| Humidity | 69% | 68% | 67% | 62% | 50% | 48% | 45% | 42% | 41% | 52% | 61% | 67% |
|---|
| Day length | 14 | 13 | 12 | 11 | 11 | 10 | 11 | 11 | 12 | 13 | 13 | 14 |
|---|
| Sun hours | 8 | 8 | 8 | 8 | 9 | 9 | 9 | 9 | 9 | 9 | 8 | 9 |
|---|
|
| Kimberley (1,200 meters) |
|---|
|
| Jan | Feb | Mar | Apr | May | Jun | Jul | Aug | Sep | Oct | Nov | Dec |
|---|
| Min temp. | 17 | 17 | 15 | 10 | 5 | 2 | 1 | 4 | 8 | 12 | 14 | 16 |
|---|
| Max temp. | 34 | 33 | 31 | 27 | 24 | 21 | 20 | 23 | 28 | 30 | 32 | 34 |
|---|
| Precip. | 55 | 65 | 70 | 45 | 20 | 15 | 5 | 10 | 10 | 30 | 45 | 60 |
|---|
| Prec. days | 6 | 9 | 8 | 5 | 3 | 1 | 1 | 1 | 1 | 4 | 5 | 6 |
|---|
| Humidity | 45% | 50% | 52% | 54% | 49% | 48% | 43% | 36% | 30% | 34% | 36% | 39% |
|---|
| Day length | 14 | 13 | 12 | 11 | 11 | 10 | 10 | 11 | 12 | 13 | 14 | 14 |
|---|
| Sun hours | 10 | 9 | 9 | 9 | 9 | 9 | 9 | 10 | 10 | 10 | 10 | 11 |
|---|
|
| Port Elizabeth |
|---|
|
| Jan | Feb | Mar | Apr | May | Jun | Jul | Aug | Sep | Oct | Nov | Dec |
|---|
| Min temp. | 17 | 17 | 16 | 13 | 11 | 8 | 8 | 9 | 10 | 13 | 14 | 16 |
|---|
| Max temp. | 26 | 27 | 26 | 24 | 23 | 22 | 22 | 21 | 21 | 22 | 24 | 25 |
|---|
| Precip. | 35 | 40 | 55 | 60 | 60 | 60 | 45 | 65 | 60 | 60 | 50 | 35 |
|---|
| Prec. days | 5 | 5 | 7 | 6 | 5 | 5 | 5 | 7 | 6 | 7 | 7 | 5 |
|---|
| Humidity | 76% | 77% | 77% | 75% | 73% | 68% | 68% | 72% | 75% | 76% | 75% | 76% |
|---|
| Day length | 14 | 13 | 12 | 11 | 10 | 10 | 10 | 11 | 12 | 13 | 14 | 14 |
|---|
| Sun hours | 9 | 8 | 7 | 7 | 7 | 7 | 7 | 8 | 7 | 8 | 8 | 9 |
|---|
| Sea temp | 23 | 24 | 23 | 22 | 22 | 21 | 20 | 19 | 20 | 20 | 21 | 22 |
|---|
| Port Nolloth |
|---|
|
| Jan | Feb | Mar | Apr | May | Jun | Jul | Aug | Sep | Oct | Nov | Dec |
|---|
| Min temp. | 15 | 15 | 14 | 13 | 12 | 11 | 11 | 11 | 12 | 13 | 14 | 15 |
|---|
| Max temp. | 21 | 21 | 21 | 21 | 19 | 19 | 19 | 18 | 19 | 19 | 20 | 21 |
|---|
| Precip. | 0 | 5 | 5 | 10 | 5 | 15 | 10 | 10 | 5 | 5 | 0 | 5 |
|---|
| Prec. days | 1 | 2 | 2 | 3 | 2 | 4 | 3 | 3 | 3 | 3 | 2 | 2 |
|---|
|
| Day length | 14 | 13 | 12 | 11 | 11 | 10 | 10 | 11 | 12 | 13 | 14 | 14 |
|---|
|
| Sea temp | 18 | 18 | 17 | 15 | 15 | 14 | 14 | 14 | 14 | 15 | 16 | 17 |
|---|
| Skukuza (300 meters) |
|---|
|
| Jan | Feb | Mar | Apr | May | Jun | Jul | Aug | Sep | Oct | Nov | Dec |
|---|
| Min temp. | 20 | 21 | 19 | 16 | 10 | 6 | 6 | 9 | 14 | 17 | 19 | 20 |
|---|
| Max temp. | 33 | 33 | 32 | 31 | 29 | 27 | 27 | 28 | 31 | 32 | 33 | 33 |
|---|
| Precip. | 95 | 95 | 70 | 35 | 15 | 10 | 10 | 10 | 25 | 45 | 65 | 95 |
|---|
| Prec. days | 9 | 8 | 8 | 5 | 3 | 2 | 1 | 2 | 3 | 6 | 9 | 9 |
|---|
|
| Day length | 14 | 13 | 12 | 12 | 11 | 11 | 11 | 11 | 12 | 13 | 13 | 14 |
|---|
| Sun hours | 7 | 8 | 7 | 7 | 8 | 8 | 8 | 8 | 8 | 7 | 6 | 7 |
|---|
|
| Sutherland (1,450 meters) |
|---|
|
| Jan | Feb | Mar | Apr | May | Jun | Jul | Aug | Sep | Oct | Nov | Dec |
|---|
| Min temp. | 11 | 10 | 7 | 4 | 3 | -1 | -3 | -2 | 0 | 3 | 6 | 8 |
|---|
| Max temp. | 30 | 30 | 27 | 23 | 20 | 15 | 15 | 17 | 20 | 25 | 26 | 29 |
|---|
| Precip. | 15 | 25 | 25 | 20 | 30 | 25 | 20 | 25 | 10 | 10 | 10 | 20 |
|---|
| Prec. days | 5 | 8 | 8 | 6 | 8 | 6 | 5 | 5 | 3 | 4 | 5 | 7 |
|---|
|
| Day length | 14 | 13 | 12 | 11 | 10 | 10 | 10 | 11 | 12 | 13 | 14 | 14 |
|---|
| Sun hours | 12 | 11 | 10 | 8 | 7 | 7 | 7 | 8 | 9 | 10 | 11 | 12 |
|---|
|
| Upington (800 meters) |
|---|
|
| Jan | Feb | Mar | Apr | May | Jun | Jul | Aug | Sep | Oct | Nov | Dec |
|---|
| Min temp. | 20 | 20 | 18 | 13 | 8 | 4 | 4 | 5 | 9 | 13 | 16 | 18 |
|---|
| Max temp. | 38 | 37 | 35 | 31 | 27 | 23 | 23 | 25 | 29 | 33 | 35 | 37 |
|---|
| Precip. | 25 | 35 | 35 | 25 | 10 | 5 | 0 | 5 | 5 | 10 | 15 | 15 |
|---|
| Prec. days | 4 | 5 | 6 | 4 | 2 | 1 | 0 | 1 | 1 | 2 | 3 | 3 |
|---|
| Humidity | 30% | 34% | 37% | 41% | 40% | 42% | 39% | 32% | 26% | 25% | 24% | 25% |
|---|
| Day length | 14 | 13 | 12 | 11 | 11 | 10 | 10 | 11 | 12 | 13 | 14 | 14 |
|---|
| Sun hours | 11 | 11 | 10 | 10 | 9 | 9 | 9 | 10 | 10 | 11 | 12 | 12 |
|---|
|
See also the
temperatures month by month