Select units of measurement for the temperature and rainfall tables (metric or imperial).
Average weather, temperature, rainfall, sunshine
In Botswana, the climate is generally
sub-tropical, with a hot, rainy season from November to March and a dry season from April to October, within which there is a cool period from May in August.
The
rains are not abundant, so much so that the climate is
arid or semi-arid depending on the area.
Botswana is a Southern African country, occupied by a
plateau that has an average altitude of around 1,000 meters (3,300 feet).
The
driest areas are the south-west, where the
Kalahari desert is found and precipitation drops below 300 millimeters (12 inches) per year, and the far east, in the valley of the Limpopo, where it goes below 400 mm (16 in) per year. The
wettest areas, where more than 500 mm (20 in) of rain fall per year, are the north and the south-east, where Gaborone is located.
In general, rainfall in the warm season is not very abundant, but during some years, it can be more abundant than usual, when the country is reached by moist air masses from Congo, or because of the remains of cyclones (see below).
In Botswana, there are several
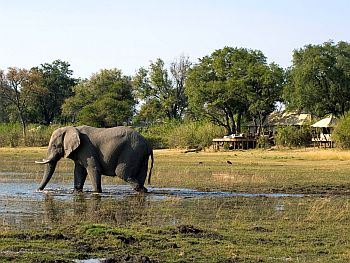
parks and nature reserves that are home to plant and animal species of the savannah, which are still little known but of great interest. Being in the Southern Hemisphere, the country has reversed seasons in comparison with the Northern Hemisphere.
The climate in detail
The seasons
The
winter, from May to August, is dry and sunny, mild during the day but cold at night, especially in the center and south.
The
summer, from November to March, is hot and moderately rainy because of thunderstorms that break out in the afternoon or evening; therefore, there's plenty of sunshine even in this season, especially in the morning.
In
spring, in September and October, the heat is often intense especially in the north, however, hot days are possible throughout the country from September to April.
The average daily
temperature of the coolest months, June and July, is around 12/13 °C (54/55 °F) in the south and 18 °C (64 °F) in the north; already in August, the temperature starts to increase.
In summer, the temperatures are more uniform across the country, in fact, they range between 25 °C and 27 °C (77 °F and 81 °F), depending on latitude but also on altitude which, however, is fairly uniform as well. The hottest months are December and January in the center-south, while in the north, the hottest days occur in October and November, before the rains that are able to lower the temperature a bit: in this period, the daytime temperature is normally around 35 °C (95 °F), but can even reach 40 °C (104 °F).
South
Kalahari
In the south-west, we find the Kalahari desert.
In
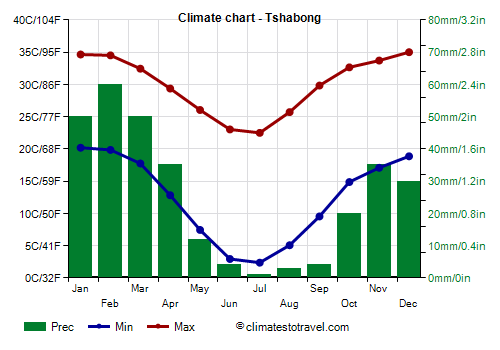
Tshabong, located in the far south-west, near the Gemsbok National Park, which is part of the Kgalagadi Transfrontier Park, in winter, nights are cold but days are mild, so there is a remarkable temperature range, while summer is definitely hot.
In this southern area, the rains are scarce, in fact, they amount to about 300 mm (12 in) per year.
In the arid southwest, the sun shines all year round.
Gaborone
The capital,
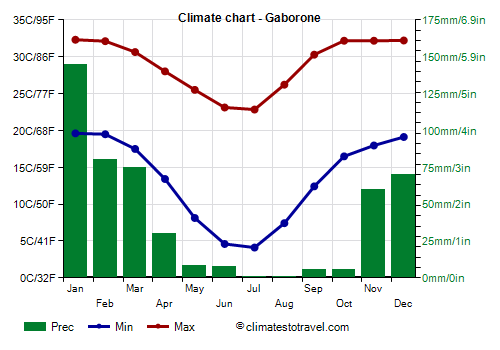
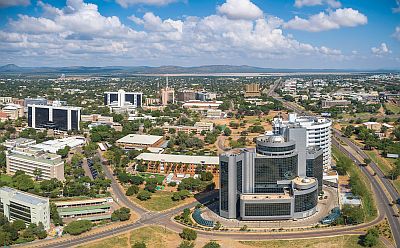
Gaborone, is located in the south-east, a short distance from the border with South Africa, and at 1,000 meters (3,300 feet) above sea level like most of the country.
From October to March, the maximum temperatures are around 30 °C (86 °F) or slightly above, but moisture is higher from December to March, at the height of the rainy season. Sometimes, the temperature can reach 36/40 °C (97/104 °F) from September to April.
In
winter, from May to August, the sun shines and it almost never rains; daytime temperatures are pleasant, while they are cold at night and get close to freezing (0 °C or 32 °F). Therefore, in winter, the temperature range between day and night is noticeable here as well.
In a typical year, 485 mm (19 in) of rain fall, of which more than 60 mm (2.3 in) fall per month from December to February.
In Gaborone, the sun shines all year round, however, because of afternoon thunderstorms, the sunshine duration decreases a little in the rainy season.
North
In the
north, winter is milder, in fact, the maximum temperature is around 26 °C (79 °F) and the minimum around 8/10 °C (46/50 °F). Moreover, as mentioned, the hottest period in the north goes from September to November, while in summer, the temperature slightly decreases because of the prevalence of more humid air masses of tropical origin.
Okavango Delta
Sometimes, however, on winter nights, it can freeze even in the north-west of the country, on the edge of the
Okavango Delta, the river that gets lost in a vast marshy area without having access to the sea.
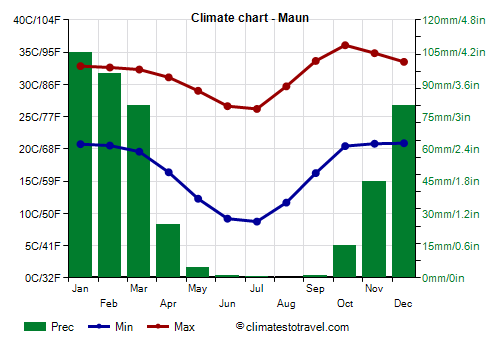
In the village of
Maun, located at 950 meters (3,100 ft) above sea level, south-east of the Okavango Delta, in October and November, at the end of the dry season, highs are normally around 35/36 °C.
Here, the rainfall amounts to 450 mm (18 in) per year.
Here, too, the sun shines all year round, but especially in the dry winter season.
To the south-east of the Okavango delta and of Maun, we find the Makgadikgadi Pan, a group of dry
salt lakes that during the rainy season receive the waters of the Boteti River (which carries the waters of the same Okavango delta) and the Nata River. The area is protected in the two neighboring national parks, Nxai Pan and Makgadikgadi Pan (see
Letlhakane).
Chobe
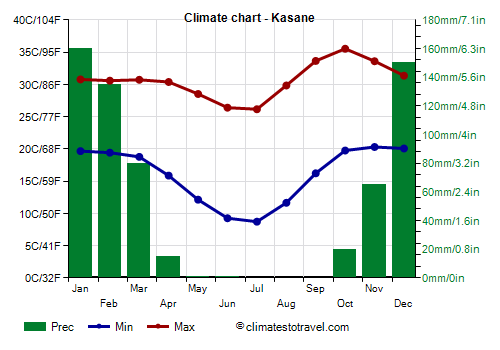
The north-east, near the border with Namibia (Caprivi Strip), Zambia and Zimbabwe, where we find the
Chobe National Park (see
Kasane), is the rainiest area of the country, in fact rainfall exceeds 600 mm (23.5 in) per year, though the rains are concentrated, as usual, in summer.
In the north-east, the sun regularly shines in the long dry season, while in the rainy period, the sunshine hours decrease a little more than in the rest of the country.
About 70 km (45 mi) to the east, on the border between Zambia and Zimbabwe, we find the
Victoria Falls.
Tropical cyclones
Occasionally, Botswana can be affected by
tropical cyclones, which originate in the Indian Ocean, and after passing over Mozambique, can reach the eastern regions of the country. Typically, they lose strength when they penetrate the mainland, but they are still able to bring a good amount of rain, as happened with Cyclone Japhet in early March 2003 and Cyclone Dineo in mid-February 2017.
The cyclone season runs from mid-November to May, but they are most likely from late December to mid-April.
When to go
The best time to visit Botswana is the austral winter,
from May to August: the sky is clear, the air is dry, it's warm during the day, and the animals of the savanna are easy to spot because they are concentrated in the few water puddles left. Certainly, you must take into account a bit of cold at night, especially in the center-south, even with possible slight frosts. Given the remarkable daily temperature range, it is necessary to dress in layers.
If you want to go in the
austral summer, for example at Christmas, you will have to reckon with rains and thunderstorms, especially in the north and in the south-east, and with the heat during the day, especially in the south and in the Kalahari. In September and October, before the arrival of the rains, the heat is intense especially in the north, but sometimes also in the rest of the country: those who are sensitive to cold and do not suffer from the heat can choose this period.
What to pack
In
winter (June to August): dress in layers and bring spring/autumn clothes, light for the day, as well as a sweater, a warm jacket and a hat for the evening.
In
summer (December to February): bring light clothes for the day, a sun hat, a sweatshirt and a spring jacket for the evening, and a light raincoat or umbrella.
Climate data - Botswana
| Francistown (1,000 meters) |
|---|
|
| Jan | Feb | Mar | Apr | May | Jun | Jul | Aug | Sep | Oct | Nov | Dec |
|---|
| Min temp. | 19 | 19 | 17 | 14 | 9 | 5 | 5 | 8 | 13 | 17 | 19 | 19 |
|---|
| Max temp. | 32 | 31 | 30 | 29 | 27 | 25 | 24 | 28 | 31 | 33 | 33 | 32 |
|---|
| Precip. | 100 | 85 | 60 | 25 | 10 | 0 | 0 | 0 | 10 | 30 | 60 | 90 |
|---|
| Prec. days | 9 | 6 | 5 | 3 | 1 | 1 | 0 | 0 | 1 | 3 | 7 | 9 |
|---|
| Humidity | 61% | 63% | 61% | 56% | 50% | 50% | 47% | 40% | 38% | 41% | 50% | 59% |
|---|
| Day length | 13 | 13 | 12 | 12 | 11 | 11 | 11 | 11 | 12 | 13 | 13 | 13 |
|---|
|
|
| Gaborone (1,000 meters) |
|---|
|
| Jan | Feb | Mar | Apr | May | Jun | Jul | Aug | Sep | Oct | Nov | Dec |
|---|
| Min temp. | 20 | 19 | 18 | 13 | 8 | 5 | 4 | 7 | 12 | 16 | 18 | 19 |
|---|
| Max temp. | 32 | 32 | 31 | 28 | 26 | 23 | 23 | 26 | 30 | 32 | 32 | 32 |
|---|
| Precip. | 145 | 80 | 75 | 30 | 10 | 10 | 0 | 0 | 5 | 5 | 60 | 70 |
|---|
| Prec. days | 6 | 5 | 5 | 3 | 2 | 1 | 1 | 1 | 2 | 4 | 5 | 6 |
|---|
| Humidity | 58% | 58% | 59% | 59% | 53% | 50% | 45% | 39% | 34% | 39% | 47% | 54% |
|---|
| Day length | 14 | 13 | 12 | 12 | 11 | 11 | 11 | 11 | 12 | 13 | 13 | 14 |
|---|
| Sun hours | 9 | 9 | 9 | 8 | 9 | 10 | 10 | 10 | 10 | 10 | 9 | 9 |
|---|
|
| Ghanzi (1,100 meters) |
|---|
|
| Jan | Feb | Mar | Apr | May | Jun | Jul | Aug | Sep | Oct | Nov | Dec |
|---|
| Min temp. | 20 | 19 | 18 | 14 | 9 | 6 | 5 | 8 | 13 | 17 | 19 | 20 |
|---|
| Max temp. | 33 | 33 | 31 | 30 | 27 | 25 | 24 | 28 | 32 | 34 | 34 | 34 |
|---|
| Precip. | 105 | 95 | 65 | 25 | 5 | 0 | 0 | 0 | 5 | 25 | 40 | 70 |
|---|
| Prec. days | 8 | 7 | 6 | 3 | 1 | 1 | 0 | 0 | 1 | 3 | 6 | 6 |
|---|
| Humidity | 54% | 55% | 58% | 48% | 43% | 41% | 38% | 31% | 28% | 32% | 41% | 48% |
|---|
| Day length | 13 | 13 | 12 | 12 | 11 | 11 | 11 | 11 | 12 | 13 | 13 | 13 |
|---|
|
|
| Jwaneng (1,200 meters) |
|---|
|
| Jan | Feb | Mar | Apr | May | Jun | Jul | Aug | Sep | Oct | Nov | Dec |
|---|
| Min temp. | 18 | 18 | 16 | 13 | 8 | 5 | 4 | 6 | 11 | 15 | 17 | 18 |
|---|
| Max temp. | 32 | 32 | 30 | 28 | 25 | 23 | 22 | 26 | 30 | 32 | 32 | 32 |
|---|
| Precip. | 85 | 70 | 55 | 40 | 15 | 10 | 15 | 25 | 25 | 40 | 50 | 60 |
|---|
| Prec. days | 11 | 11 | 8 | 9 | 5 | 5 | 7 | 6 | 6 | 8 | 10 | 10 |
|---|
| Humidity | 56% | 55% | 57% | 51% | 47% | 45% | 42% | 36% | 33% | 38% | 44% | 51% |
|---|
| Day length | 14 | 13 | 12 | 12 | 11 | 11 | 11 | 11 | 12 | 13 | 13 | 14 |
|---|
|
|
| Kasane (970 meters) |
|---|
|
| Jan | Feb | Mar | Apr | May | Jun | Jul | Aug | Sep | Oct | Nov | Dec |
|---|
| Min temp. | 20 | 19 | 19 | 16 | 12 | 9 | 9 | 12 | 16 | 20 | 20 | 20 |
|---|
| Max temp. | 31 | 31 | 31 | 30 | 29 | 26 | 26 | 30 | 34 | 36 | 34 | 31 |
|---|
| Precip. | 160 | 135 | 80 | 15 | 0 | 0 | 0 | 0 | 0 | 20 | 65 | 150 |
|---|
| Prec. days | 14 | 11 | 8 | 2 | 0 | 0 | 0 | 0 | 0 | 4 | 9 | 13 |
|---|
| Humidity | 68% | 69% | 64% | 54% | 44% | 42% | 38% | 31% | 26% | 29% | 47% | 64% |
|---|
| Day length | 13 | 13 | 12 | 12 | 11 | 11 | 11 | 12 | 12 | 12 | 13 | 13 |
|---|
| Sun hours | 6 | 8 | 8 | 9 | 10 | 10 | 10 | 11 | 10 | 9 | 9 | 7 |
|---|
|
| Letlhakane (1,000 meters) |
|---|
|
| Jan | Feb | Mar | Apr | May | Jun | Jul | Aug | Sep | Oct | Nov | Dec |
|---|
| Min temp. | 20 | 19 | 18 | 14 | 10 | 8 | 7 | 10 | 14 | 18 | 20 | 20 |
|---|
| Max temp. | 32 | 33 | 32 | 30 | 28 | 25 | 25 | 28 | 32 | 34 | 34 | 33 |
|---|
| Precip. | 85 | 70 | 50 | 25 | 5 | 0 | 0 | 0 | 5 | 20 | 45 | 65 |
|---|
| Prec. days | 11 | 9 | 6 | 4 | 1 | 0 | 0 | 0 | 1 | 4 | 8 | 9 |
|---|
| Humidity | 60% | 59% | 59% | 54% | 49% | 49% | 46% | 39% | 35% | 39% | 47% | 58% |
|---|
| Day length | 13 | 13 | 12 | 12 | 11 | 11 | 11 | 11 | 12 | 13 | 13 | 13 |
|---|
|
|
| Maun (950 meters) |
|---|
|
| Jan | Feb | Mar | Apr | May | Jun | Jul | Aug | Sep | Oct | Nov | Dec |
|---|
| Min temp. | 21 | 21 | 20 | 16 | 12 | 9 | 9 | 12 | 16 | 20 | 21 | 21 |
|---|
| Max temp. | 33 | 33 | 32 | 31 | 29 | 27 | 26 | 30 | 34 | 36 | 35 | 34 |
|---|
| Precip. | 105 | 95 | 80 | 25 | 5 | 0 | 0 | 0 | 0 | 15 | 45 | 80 |
|---|
| Prec. days | 13 | 12 | 8 | 5 | 1 | 0 | 0 | 0 | 0 | 3 | 9 | 10 |
|---|
| Humidity | 62% | 63% | 60% | 52% | 43% | 43% | 39% | 31% | 27% | 30% | 44% | 58% |
|---|
| Day length | 13 | 13 | 12 | 12 | 11 | 11 | 11 | 12 | 12 | 13 | 13 | 13 |
|---|
| Sun hours | 8 | 7 | 8 | 9 | 10 | 10 | 10 | 11 | 10 | 10 | 9 | 8 |
|---|
|
| Selebi Phikwe (870 meters) |
|---|
|
| Jan | Feb | Mar | Apr | May | Jun | Jul | Aug | Sep | Oct | Nov | Dec |
|---|
| Min temp. | 21 | 21 | 19 | 15 | 11 | 8 | 7 | 11 | 15 | 18 | 20 | 21 |
|---|
| Max temp. | 31 | 31 | 30 | 28 | 27 | 24 | 24 | 27 | 30 | 31 | 32 | 31 |
|---|
| Precip. | 95 | 55 | 50 | 25 | 5 | 0 | 0 | 0 | 15 | 25 | 60 | 80 |
|---|
| Prec. days | 9 | 7 | 5 | 4 | 1 | 1 | 0 | 0 | 2 | 4 | 7 | 8 |
|---|
| Humidity | 60% | 60% | 62% | 60% | 51% | 53% | 50% | 45% | 43% | 47% | 51% | 59% |
|---|
| Day length | 13 | 13 | 12 | 12 | 11 | 11 | 11 | 11 | 12 | 13 | 13 | 14 |
|---|
|
|
| Shakawe (1,000 meters) |
|---|
|
| Jan | Feb | Mar | Apr | May | Jun | Jul | Aug | Sep | Oct | Nov | Dec |
|---|
| Min temp. | 20 | 20 | 19 | 16 | 11 | 7 | 6 | 9 | 14 | 18 | 20 | 20 |
|---|
| Max temp. | 32 | 32 | 32 | 31 | 29 | 27 | 26 | 30 | 34 | 36 | 35 | 33 |
|---|
| Precip. | 135 | 120 | 70 | 30 | 0 | 0 | 0 | 0 | 5 | 15 | 60 | 90 |
|---|
| Prec. days | 14 | 12 | 9 | 3 | 0 | 0 | 0 | 0 | 1 | 4 | 8 | 10 |
|---|
| Humidity | 64% | 64% | 60% | 50% | 46% | 43% | 41% | 33% | 28% | 32% | 44% | 60% |
|---|
| Day length | 13 | 13 | 12 | 12 | 11 | 11 | 11 | 12 | 12 | 12 | 13 | 13 |
|---|
|
|
| Sowa (930 meters) |
|---|
|
| Jan | Feb | Mar | Apr | May | Jun | Jul | Aug | Sep | Oct | Nov | Dec |
|---|
| Min temp. | 21 | 20 | 19 | 15 | 11 | 8 | 8 | 10 | 14 | 18 | 20 | 20 |
|---|
| Max temp. | 33 | 33 | 33 | 32 | 29 | 27 | 26 | 30 | 33 | 36 | 36 | 34 |
|---|
| Precip. | 100 | 85 | 55 | 25 | 0 | 0 | 0 | 0 | 5 | 20 | 50 | 85 |
|---|
| Prec. days | 12 | 10 | 6 | 3 | 1 | 0 | 0 | 0 | 1 | 4 | 8 | 11 |
|---|
| Humidity | 59% | 60% | 56% | 49% | 46% | 47% | 44% | 37% | 34% | 36% | 44% | 56% |
|---|
| Day length | 13 | 13 | 12 | 12 | 11 | 11 | 11 | 12 | 12 | 13 | 13 | 13 |
|---|
|
|
| Tshabong (960 meters) |
|---|
|
| Jan | Feb | Mar | Apr | May | Jun | Jul | Aug | Sep | Oct | Nov | Dec |
|---|
| Min temp. | 20 | 20 | 18 | 13 | 7 | 3 | 2 | 5 | 10 | 15 | 17 | 19 |
|---|
| Max temp. | 35 | 35 | 32 | 29 | 26 | 23 | 22 | 26 | 30 | 33 | 34 | 35 |
|---|
| Precip. | 50 | 60 | 50 | 35 | 10 | 5 | 0 | 5 | 5 | 20 | 35 | 30 |
|---|
| Prec. days | 6 | 7 | 6 | 5 | 2 | 1 | 0 | 1 | 1 | 3 | 4 | 5 |
|---|
| Humidity | 47% | 48% | 52% | 52% | 49% | 48% | 44% | 38% | 32% | 32% | 35% | 40% |
|---|
| Day length | 14 | 13 | 12 | 11 | 11 | 10 | 11 | 11 | 12 | 13 | 13 | 14 |
|---|
| Sun hours | 11 | 10 | 10 | 10 | 10 | 10 | 10 | 11 | 11 | 11 | 11 | 11 |
|---|
|
| Tshane (1,100 meters) |
|---|
|
| Jan | Feb | Mar | Apr | May | Jun | Jul | Aug | Sep | Oct | Nov | Dec |
|---|
| Min temp. | 21 | 21 | 19 | 15 | 10 | 6 | 6 | 8 | 12 | 18 | 19 | 20 |
|---|
| Max temp. | 33 | 34 | 32 | 30 | 26 | 24 | 24 | 26 | 30 | 33 | 33 | 33 |
|---|
| Precip. | 75 | 70 | 60 | 35 | 10 | 5 | 0 | 0 | 5 | 20 | 35 | 35 |
|---|
| Prec. days | 9 | 8 | 6 | 5 | 2 | 0 | 0 | 0 | 1 | 4 | 6 | 7 |
|---|
| Humidity | 44% | 44% | 44% | 38% | 36% | 36% | 31% | 27% | 25% | 27% | 34% | 41% |
|---|
| Day length | 13 | 13 | 12 | 12 | 11 | 11 | 11 | 11 | 12 | 13 | 13 | 14 |
|---|
|
|
See also the
temperatures month by month