Select units of measurement for the temperature and rainfall tables (metric or imperial).
Average weather, temperature, rainfall, sunshine
In Mozambique, a country located in south-east Africa, very extended in latitude, the climate is
tropical, with a hot, rainy season from December to March and a dry season from May to November, during which there is a cooler period from mid-May to mid-August.
In
inland areas, especially in the north-central, there are highlands and mountain ranges, where the altitude tempers the climate. On the other hand, in the lowlands, for example in the Zambezi Valley, there can be
intense heat in the hot, rainy season of the austral summer, and even more so in the period preceding the rains (September to November).
Being in the Southern Hemisphere, Mozambique has reversed seasons compared with Europe or North America.
The climate in detail
The seasons
During
winter, from May to August, the south-east trade winds bring
pleasant and sunny weather. However, in the southernmost provinces (Gaza, Maputo, Inhambane),
cool air masses can arrive from South Africa, bringing a bit of cold at night, especially in inland areas.
From June to October, the rains are very rare almost everywhere, although some brief showers are possible along the central part of the coast, from Quelimane to Beira.
Starting from mid-August, the temperature rises, especially in inland areas, and in the following months, before the rains, there is the
hottest period of the year, with a peak in October and November. The rains gradually increase, especially in mountainous areas, even though the rainy season has not yet begun.
The
summer, from December to March, is rainy, and it is hot and muggy at sea level, and cooler in the mountains. In this season, the north-west monsoon prevails, at least in the center and north, which are affected by humid currents from the Democratic Republic of Congo. In the south, the trade winds still prevail, however, unlike in winter, there are enough heat and humidity for the formation of thunderclouds, so the trade winds are able to bring rainfall as well, even though these rains are less intense than in the center-north.
The rains occur primarily in the form of showers and thunderstorms in the afternoon, so even in the rainy season, the amount of
sunshine is not low.
However, in the northern
mountainous areas, the sky is often cloudy. In addition to these mountains, in the west of the country, on the border with Zimbabwe, we find another mountain, which is actually the highest, Mount Binga, 2,440 meters (8,004 feet) high.
The country offers many
attractions that are still not known by many tourists and, as a consequence, are still pristine. In the
Niassa National Reserve, located in the north and on the border with Tanzania, there are elephants, zebras and other animals of the savanna.
There are also coral islands and marine parks, such as the
Quirimbas National Park in the north, located in the Quirimbas archipelago, where the island of Matemo is found, and the
Bazaruto National Park, in the southern archipelago of Bazaruto. On the contrary, the
Gorongosa Park was damaged during the civil war that ended in 1992 and is now undergoing redevelopment.
The north

In the north, the temperatures are fairly stable throughout the year; however, they decrease a bit from May to August, when a bit of cool air can arrive from the south, especially in inland areas.
Pemba
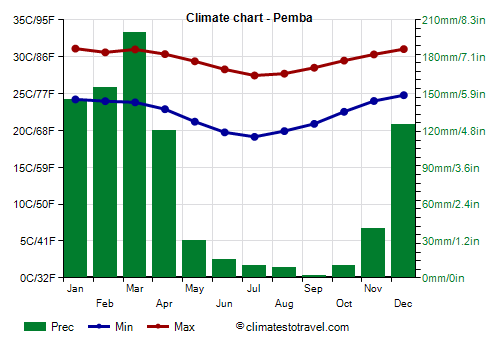 Pemba
Pemba, the capital of the Cabo Delgado Province, and the starting point for the national parks located in the north of the country, such as the Quirimbas National Park, lies on the northeastern coast, and its position near the Equator is evidenced by the fact that it remains warm even in winter. The average temperature ranges from 27.5 °C (82 °F) in January to 23 °C (73 °F) in July.
Rainfall in Pemba amounts to 860 mm (34 in) per year, including more than 100 mm (4 in) from December to April, and a maximum of 200 mm (8 in) in March.
The sunniest period in Pemba is from August to November, ie at the end of the dry season, while the least sunny is the wettest, from January to March.
The sea temperature in this northern part of the coast is high enough for swimming all year round, however, it decreases to 25/26 °C (77/79 °F) from July to September.
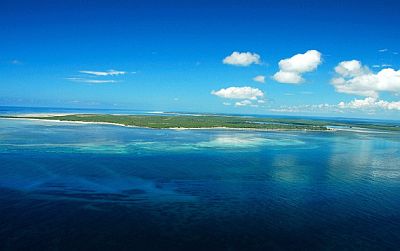
North of Pemba we find the
Quirimbas archipelago, while to the south, and near the town of Lumbo, we find the
island of Mozambique.
Nampula
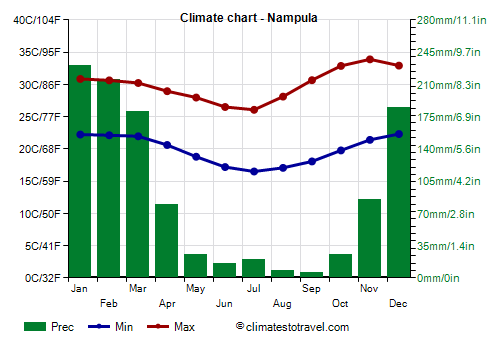
In the inland areas of the north, the altitude increases. Already in
Nampula, located 140 km (85 mi) west of the coast and 360 meters (1,200 ft) above sea level, the daytime temperature drops to 26/28 °C (79/82 °F) from May to August.
In Nampula, 1,050 mm (41 in) of rain fall per year, with abundant rainfall from December to March, and rare rains from May to October.
Lichinga
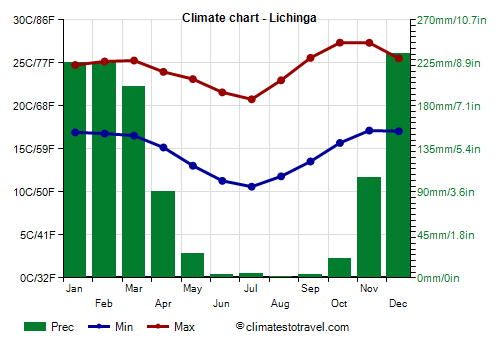
Further west, in the province of Niassa, there is a
plateau. The capital of the province,
Lichinga, is located at 1,400 meters (4,600 feet) of altitude. Here, the climate is mild or pleasantly warm during the day (but the sun is very strong), and cool or even cold at night. From June to August, after
cold air outbreaks from the south, the night temperature can drop to around 5 °C (41 °F), while during the day, the temperature can reach or exceed 30 °C (86 °F) from September to November.
In Lichinga, the rains are abundant from December to March, while there is a long dry season from May to October.
To the west of Lichinga, a part of
Lake Malawi (or Niassa) belongs to Mozambique. The banks are located about 500 meters (1,600 feet) above sea level, so the temperature is high all year round, even though it decreases a little from May to August.
Tete
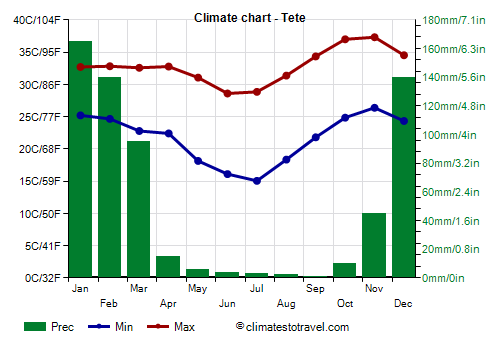
In the north-west, the Zambezi Valley, in the Tete Province, is
the hottest area, as well as one of the driest, of the country.
In
Tete, the heat is intense for many months of the year, and slightly decreases only from May to August; the temperature can reach 45 °C (113 °F) in October and November, while it can exceed 40 °C (104 °F) from December to April.
In Tete, only 630 millimeters (25 inches) of rain fall per year.
The sun shines more often in the dry season, from April to November, than in the rainy season, when in any case, it does not shine rarely.
North-west of Tete, we find an artificial lake,
Cahora Bassa, where the climate is similar to that of Tete.
The center-south

In the central-southern part of Mozambique, in the austral winter, the temperatures decrease more clearly. And so, from May to August, the temperatures are pleasantly warm during the day, but a little cool at night, and sometimes a bit cold, especially in inland areas.
The
central part of the coast (see Quelimane, Beira) is one of the wettest areas, together with the north-west inland area, ie the mountainous areas to the south-east of Lake Malawi (or Niassa) and near Mount Chiperone and Mount Namuli: in both areas, precipitation is around 1,400/1,600 mm (55/63 in) per year, or even higher.
Quelimane
In
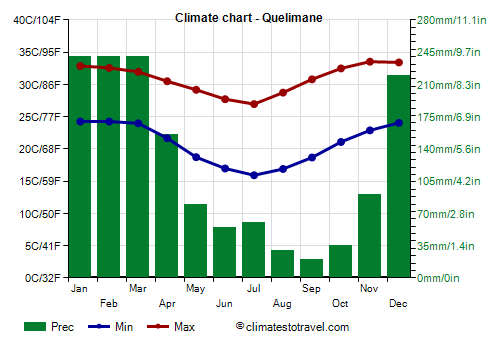
Quelimane, the capital of the province of Zambezia, located in the central part of the coast, the average temperature in July drops to 21.5 °C (70.5 °F).
The rains are abundant from December to March, however, some rain is possible even in winter, especially in June and July.
The sun in Quelimane shines for a good number of hours even in the rainy period, which confirms that the rains take place in the form of downpours and do not last long.
Near Quelimane, the sea is warm enough for swimming all year round, even though the water temperature drops to 24.5/25 °C (76/77 °F) from July to September.
Beira
On the coast south of Quelimane, we find
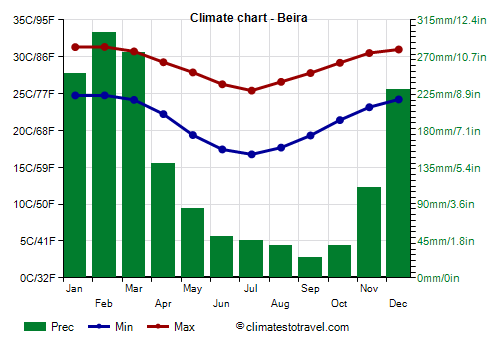
Beira, the fourth city of the country, and the capital of the Sofala Province, where the climate is similar to that of Quelimane.
Rainfall amounts to almost 1,600 mm (63 in) per year.
In Beira too, the sun shines for a good number of hours even in the rainy season.
Near Beira, the sea is warm enough for swimming all year round, even though the water temperature drops to 24/25 °C from June to October.
North of Beira, and still in the Sofala Province, we find the
Gorongosa National Park. The park is covered by savannahs and grasslands, and includes lakes and marshes that widen considerably in the rainy season. The park is flat, but a short distance to the west, we find Mount Gorongosa, 1,863 meters (6,112 feet) high, which in 2010 was added to the park of the same name.
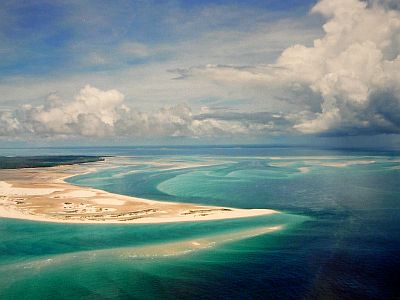
On the coast to the south of Beira and to the east of the town of Vilanculos, we find the
Bazaruto archipelago. Here too, the weather is a bit cool in the winter months.
Inhambane
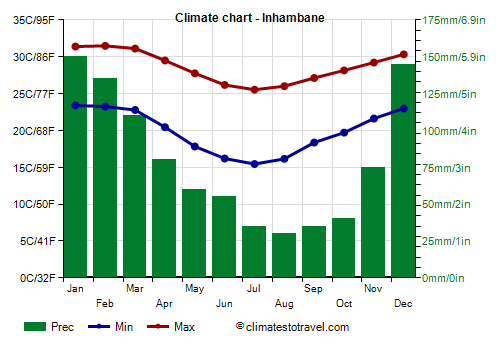
On the coast to the south of Bazaruto, in the province of
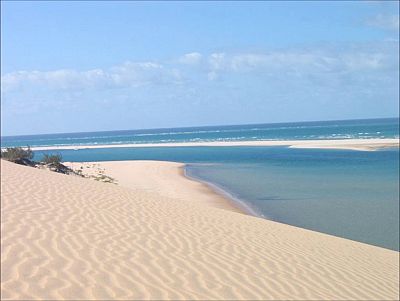
Inhambane, we find beaches and coral reefs, and popular places such as Guinjata, Manta Reef, Tofo Beach and Gallaria.
From July to September, in the Mozambique Channel, you can watch humpback whales, which come to breed before returning to colder seas.
In the south-west, on the border with South Africa, beyond which the Kruger Park is located, we find the
Limpopo National Park, where precipitation drops below 500 mm (20 in) per year, so it is the most arid area of the country, even more arid than the Zambezi valley.
Maputo
The capital,
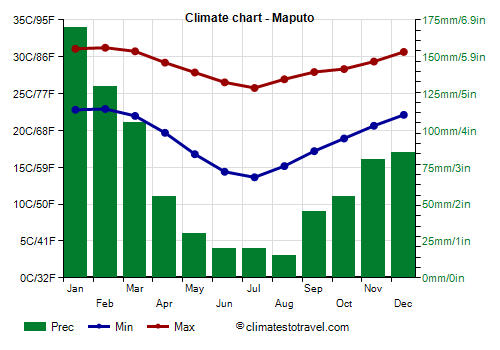
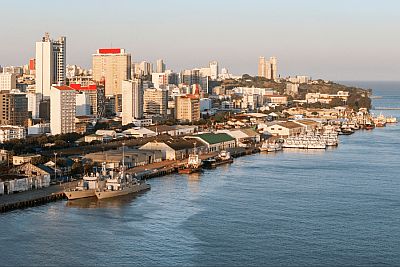
Maputo, is located in the far south, on the coast, and has an average temperature ranging from 27 °C (80.5 °F) in January to 19.5 °C (67.5 °F) in July.
Although the maximum temperature in the warmest months (January and February) is on average around 31 °C (88 °F), it can sometimes get
uncomfortably hot, up to 38/39 °C (100/102 °F).
Instead, on winter nights it can get sometimes
very cool, in fact, from May to August, the temperature can drop to around 10 °C (50 °F).
On average, 815 mm (32 in) of rain fall per year, most of which fall from November to March. The rainiest month is January. However, the rains are quite erratic and may be more abundant during some years.
The sun in Maputo shines for a good number of hours even in the rainy season, from November to March.
The sea temperature in this southern part of the coast is high enough for swimming all year round, however, it decreases to 22.5/23 °C (72.5/73 °F) from July to September.
Near Maputo, we find
Matola, the most populated city in the country.
Tropical cyclones
Mozambique is located in the area affected by
tropical cyclones, which hit the east coast, after passing over Madagascar. The official cyclone season in the south-west Indian Ocean runs from November 1st to May 15th, but the period when they are most likely runs from late December to mid-April.
The most intense cyclones can be destructive, bringing gale force winds and torrential rainfall, as happened with Cyclone Idai in March 2019, which particularly affected the area of Beira.
When to go
The best time to go to Mozambique, for safaris and excursions or for visiting cities, goes
from mid-May to August, in fact it's the coolest, the driest and the sunniest of the year. However, it is worth while to recall that in this period, it can get cold at night in the interior, and in the highest peaks, above 2,000 meters (6,500 feet), there may be slight frosts.
Those who don't like the heat can keep in mind that in inland areas, the months of June and July are the coolest: by mid-August, the temperature starts to rise, and the first hot days may occur in the interior.
In
September and October, it's definitely hot in the inland lowland areas (see Tete and the Zambezi Valley), while the rainy season, in addition to being hot and sultry, poses the risk of cyclones.
For a
beach holiday, in the center-south, September and October are preferable, especially for those who suffer from the cold, since the weather can get a little cool from June to August, while in the north, you can go from mid-May to October inclusive.
What to pack
In
winter (June to August): for the central and southern coast (Maputo, Inhambane, Bazaruto, Beira), bring spring/autumn clothes (light for the day), and a sweater and a light jacket for the evening. For the north coast (Pemba, Mozambique Island), bring light clothing, a sweatshirt for the evening, and a scarf for the breeze. For the mountainous areas, spring/autumn clothes during the day, and a sweater, a jacket and a hat for the evening.
When going to the reef, you can bring snorkeling equipment, including water shoes or rubber-soled shoes.
In
summer (December to March): throughout the coast and the inland areas at low altitudes (Zambezi Valley, Limpopo National Park), bring tropics-friendly, loose-fitting clothing, light shirts and pants of natural fibers (cotton, linen), a sun hat, a light sweatshirt for the evening, and a light raincoat or umbrella. For the mountainous areas, spring/autumn clothes, a jacket, a raincoat, a sun hat, and hiking shoes.
When going to the reef, you can bring snorkeling equipment, including water shoes or rubber-soled shoes.
Climate data - Mozambique
| Beira |
|---|
|
| Jan | Feb | Mar | Apr | May | Jun | Jul | Aug | Sep | Oct | Nov | Dec |
|---|
| Min temp. | 25 | 25 | 24 | 22 | 19 | 17 | 17 | 18 | 19 | 21 | 23 | 24 |
|---|
| Max temp. | 31 | 31 | 31 | 29 | 28 | 26 | 25 | 27 | 28 | 29 | 31 | 31 |
|---|
| Precip. | 250 | 300 | 275 | 140 | 85 | 50 | 45 | 40 | 25 | 40 | 110 | 230 |
|---|
| Prec. days | 11 | 13 | 12 | 8 | 7 | 7 | 8 | 5 | 3 | 5 | 7 | 10 |
|---|
| Humidity | 76% | 78% | 79% | 78% | 78% | 78% | 79% | 77% | 76% | 75% | 75% | 76% |
|---|
| Day length | 13 | 13 | 12 | 12 | 11 | 11 | 11 | 12 | 12 | 13 | 13 | 13 |
|---|
| Sun hours | 8 | 8 | 8 | 8 | 8 | 7 | 8 | 8 | 8 | 8 | 8 | 8 |
|---|
| Sea temp | 28 | 29 | 29 | 28 | 26 | 25 | 24 | 24 | 24 | 25 | 27 | 28 |
|---|
| Inhambane |
|---|
|
| Jan | Feb | Mar | Apr | May | Jun | Jul | Aug | Sep | Oct | Nov | Dec |
|---|
| Min temp. | 23 | 23 | 23 | 20 | 18 | 16 | 15 | 16 | 18 | 20 | 22 | 23 |
|---|
| Max temp. | 31 | 31 | 31 | 30 | 28 | 26 | 26 | 26 | 27 | 28 | 29 | 30 |
|---|
| Precip. | 150 | 135 | 110 | 80 | 60 | 55 | 35 | 30 | 35 | 40 | 75 | 145 |
|---|
| Prec. days | 5 | 6 | 5 | 4 | 3 | 3 | 2 | 2 | 2 | 2 | 4 | 5 |
|---|
| Humidity | 70% | 72% | 71% | 73% | 72% | 73% | 72% | 71% | 72% | 70% | 71% | 73% |
|---|
| Day length | 13 | 13 | 12 | 12 | 11 | 11 | 11 | 11 | 12 | 13 | 13 | 14 |
|---|
| Sun hours | 7 | 7 | 7 | 7 | 7 | 6 | 7 | 7 | 7 | 7 | 6 | 7 |
|---|
| Sea temp | 28 | 28 | 28 | 27 | 26 | 25 | 24 | 24 | 24 | 25 | 26 | 27 |
|---|
| Lichinga (1,350 meters) |
|---|
|
| Jan | Feb | Mar | Apr | May | Jun | Jul | Aug | Sep | Oct | Nov | Dec |
|---|
| Min temp. | 17 | 17 | 17 | 15 | 13 | 11 | 11 | 12 | 14 | 16 | 17 | 17 |
|---|
| Max temp. | 25 | 25 | 25 | 24 | 23 | 22 | 21 | 23 | 26 | 27 | 27 | 26 |
|---|
| Precip. | 225 | 225 | 200 | 90 | 25 | 5 | 5 | 0 | 5 | 20 | 105 | 235 |
|---|
| Prec. days | 19 | 17 | 18 | 10 | 3 | 1 | 1 | 0 | 1 | 3 | 9 | 18 |
|---|
| Humidity | 86% | 84% | 82% | 79% | 74% | 69% | 66% | 62% | 55% | 58% | 65% | 81% |
|---|
| Day length | 13 | 12 | 12 | 12 | 12 | 11 | 11 | 12 | 12 | 12 | 13 | 13 |
|---|
| Sun hours | 4 | 5 | 5 | 6 | 8 | 7 | 7 | 8 | 8 | 9 | 7 | 4 |
|---|
|
| Maputo |
|---|
|
| Jan | Feb | Mar | Apr | May | Jun | Jul | Aug | Sep | Oct | Nov | Dec |
|---|
| Min temp. | 23 | 23 | 22 | 20 | 17 | 14 | 14 | 15 | 17 | 19 | 21 | 22 |
|---|
| Max temp. | 31 | 31 | 31 | 29 | 28 | 27 | 26 | 27 | 28 | 28 | 29 | 31 |
|---|
| Precip. | 170 | 130 | 105 | 55 | 30 | 20 | 20 | 15 | 45 | 55 | 80 | 85 |
|---|
| Prec. days | 8 | 8 | 7 | 4 | 3 | 2 | 2 | 2 | 3 | 6 | 8 | 8 |
|---|
| Humidity | 73% | 73% | 73% | 72% | 71% | 68% | 68% | 67% | 68% | 70% | 72% | 72% |
|---|
| Day length | 14 | 13 | 12 | 11 | 11 | 10 | 11 | 11 | 12 | 13 | 13 | 14 |
|---|
| Sun hours | 7 | 7 | 7 | 8 | 8 | 8 | 8 | 8 | 8 | 7 | 7 | 7 |
|---|
| Sea temp | 27 | 27 | 27 | 26 | 25 | 24 | 23 | 22 | 23 | 24 | 25 | 26 |
|---|
| Nampula (400 meters) |
|---|
|
| Jan | Feb | Mar | Apr | May | Jun | Jul | Aug | Sep | Oct | Nov | Dec |
|---|
| Min temp. | 22 | 22 | 22 | 21 | 19 | 17 | 16 | 17 | 18 | 20 | 21 | 22 |
|---|
| Max temp. | 31 | 31 | 30 | 29 | 28 | 26 | 26 | 28 | 31 | 33 | 34 | 33 |
|---|
| Precip. | 230 | 215 | 180 | 80 | 25 | 15 | 20 | 10 | 5 | 25 | 85 | 185 |
|---|
| Prec. days | 15 | 13 | 13 | 8 | 4 | 3 | 4 | 2 | 1 | 2 | 6 | 11 |
|---|
| Humidity | 77% | 77% | 78% | 76% | 72% | 71% | 70% | 65% | 59% | 56% | 57% | 67% |
|---|
| Day length | 13 | 13 | 12 | 12 | 11 | 11 | 11 | 12 | 12 | 12 | 13 | 13 |
|---|
|
|
| Pemba |
|---|
|
| Jan | Feb | Mar | Apr | May | Jun | Jul | Aug | Sep | Oct | Nov | Dec |
|---|
| Min temp. | 24 | 24 | 24 | 23 | 21 | 20 | 19 | 20 | 21 | 23 | 24 | 25 |
|---|
| Max temp. | 31 | 31 | 31 | 30 | 29 | 28 | 27 | 28 | 29 | 29 | 30 | 31 |
|---|
| Precip. | 145 | 155 | 200 | 120 | 30 | 15 | 10 | 10 | 0 | 10 | 40 | 125 |
|---|
| Prec. days | 11 | 10 | 13 | 9 | 3 | 2 | 2 | 1 | 1 | 1 | 4 | 8 |
|---|
| Humidity | 82% | 83% | 81% | 77% | 75% | 73% | 73% | 74% | 74% | 75% | 76% | 79% |
|---|
| Day length | 13 | 12 | 12 | 12 | 12 | 11 | 11 | 12 | 12 | 12 | 13 | 13 |
|---|
| Sun hours | 6 | 6 | 6 | 7 | 8 | 8 | 7 | 8 | 9 | 9 | 9 | 8 |
|---|
| Sea temp | 29 | 29 | 29 | 29 | 28 | 27 | 26 | 25 | 26 | 27 | 28 | 29 |
|---|
| Quelimane |
|---|
|
| Jan | Feb | Mar | Apr | May | Jun | Jul | Aug | Sep | Oct | Nov | Dec |
|---|
| Min temp. | 24 | 24 | 24 | 22 | 19 | 17 | 16 | 17 | 19 | 21 | 23 | 24 |
|---|
| Max temp. | 33 | 33 | 32 | 30 | 29 | 28 | 27 | 29 | 31 | 32 | 34 | 33 |
|---|
| Precip. | 240 | 240 | 240 | 155 | 80 | 55 | 60 | 30 | 20 | 35 | 90 | 220 |
|---|
| Prec. days | 11 | 13 | 13 | 10 | 8 | 8 | 8 | 4 | 2 | 3 | 5 | 11 |
|---|
| Humidity | 78% | 78% | 80% | 78% | 78% | 78% | 77% | 74% | 71% | 70% | 69% | 75% |
|---|
| Day length | 13 | 13 | 12 | 12 | 11 | 11 | 11 | 12 | 12 | 12 | 13 | 13 |
|---|
| Sun hours | 7 | 7 | 7 | 8 | 8 | 7 | 7 | 8 | 9 | 8 | 9 | 8 |
|---|
| Sea temp | 29 | 29 | 29 | 28 | 27 | 26 | 25 | 24 | 25 | 26 | 27 | 28 |
|---|
| Tete |
|---|
|
| Jan | Feb | Mar | Apr | May | Jun | Jul | Aug | Sep | Oct | Nov | Dec |
|---|
| Min temp. | 25 | 25 | 23 | 22 | 18 | 16 | 15 | 18 | 22 | 25 | 26 | 24 |
|---|
| Max temp. | 33 | 33 | 33 | 33 | 31 | 29 | 29 | 31 | 34 | 37 | 37 | 35 |
|---|
| Precip. | 165 | 140 | 95 | 15 | 5 | 5 | 5 | 0 | 0 | 10 | 45 | 140 |
|---|
| Prec. days | 11 | 9 | 7 | 2 | 1 | 1 | 1 | 0 | 0 | 1 | 4 | 10 |
|---|
| Humidity | 73% | 74% | 70% | 59% | 57% | 57% | 52% | 48% | 43% | 40% | 46% | 68% |
|---|
| Day length | 13 | 13 | 12 | 12 | 11 | 11 | 11 | 12 | 12 | 12 | 13 | 13 |
|---|
| Sun hours | 6 | 7 | 8 | 8 | 8 | 8 | 8 | 9 | 9 | 9 | 8 | 7 |
|---|
|
See also the
temperatures month by month