Select units of measurement for the temperature and rainfall tables (metric or imperial).
Average weather, temperature, rainfall, sunshine
In Malaysia, an Asian state located just north of the equator, the climate is
equatorial, ie hot, humid and rainy throughout the year.
Temperatures are high and stable. However, there is usually a slight decrease between November and January, when highs drop to 30/31 °C (86/88 °F), and a slight increase (which, however, is felt because of the high humidity) between March and August, when highs hover around 32/33 °C (90/91 °F). The night temperatures fluctuate around 23/25 °C (73/77 °F) all year round, and almost never drop below 20 °C (68 °F).
Rainfall is abundant and frequent throughout the year, in fact, it is difficult to find an area where it is lower than 2,000 millimeters (79 inches) per year, or a month when it is lower than 100 mm (4 in); however, it is possible to find periods when it is not too high, although they are not the same everywhere.
The rains are caused by the
monsoon regime, however, being that Malaysia is near the Equator and surrounded by the sea, there is no real dry season. In addition, the rains, as is generally the case in tropical countries, are quite erratic from year to year.
However, the monsoons make rainfall more abundant and frequent in the areas directly exposed to these winds. Between mid-October and January, the
northeast monsoon prevails, affecting especially the east coast of Peninsular Malaysia and the north-east coast of Borneo, while between June and September, it's the period of the
southwest monsoon, which, in Malaysia, usually produces weaker effects.
It should be noted, however, that the tropical rains occur mainly in the form of
downpours or thunderstorms, so the
sun shines on average for a few hours a day. Generally, there are 1,800 hours of sunshine per year in the wettest areas and 2,500 in the least rainy ones.
The
sea in Malaysia is warm all year round.
The country is divided into two parts:
Peninsular Malaysia, also called Western Malaysia, located in the Malay Peninsula, and
Eastern Malaysia, or Malaysian Borneo, located on the island of Borneo.
The climate in detail
1- Peninsular Malaysia
The
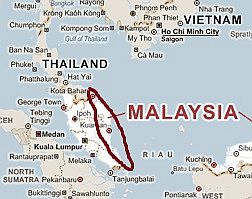
east coast of Peninsular Malaysia is
directly affected by the northeast monsoon; here, from 2,500 to 3,000 mm (98 to 118 in) of rain fall per year. The rains are
very abundant in November and December, when they even exceed 500 mm (20 in) per month. This unfavorable period can linger until January, especially in the central and southern part, and during some years, even in the norhern one.
In
Kota Bharu, located in the far north, at 6 degrees north latitude, near the border with Thailand, November and December are clearly distinguishable as the worst months, in fact, they are characterized by torrential rains.
The best period is from February to April, when rainfall often drops below 100 mm (4 in) per month (but not in all years), and February is the absolute best because it is a bit less hot.
The rains gradually increase again by May, but as mentioned, there is a substantial increase only in November.
This trend is also found in the nearby
Redang and Perhentian archipelagos, where tourist facilities are often closed from November to January.
In Kota Bharu, as in the rest of Malaysia, it's hot all year round, however, in this northernmost area, the period from December to February is slightly cooler.
The temperature hardly ever drops below 20 °C (68 °F).
On the hottest days of the year, the temperature generally reaches 34/35 °C (93/95 °F) in April and May, but sometimes also in the following months until August.
Continuing south (see Kuala Terengganu), and therefore moving closer to the Equator, the trend remains similar, but the driest period from February to April becomes less noticeable, so there is no substantial difference from February to July, which therefore is the best period of the year. However, in this period too, it can rain, in fact the rainfall is still above 100 mm (4 in) per month.
A similar trend is found more to the south, on the island of
Tioman, where there is more or less the same amount of rainfall from February to September, although, after all, the best month is February here as well.
Along the
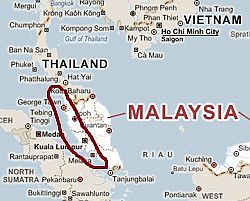
west coast of Peninsular Malaysia, which overlooks the Strait of Malacca, the rains are a bit less abundant, in fact, they range from 1,800 to 2,500 mm (70 to 98 in) per year. Moreover, the rainfall pattern is substantially different: there is no peak between November and January, which are relatively dry months, especially in the north, since there are
mountains in the interior, which block the north-eastern winds, which as previously mentioned, prevail in this period.
In
Langkawi, an island located a short distance from the coast, less than 110 mm (4.3 in) or fain fall from December to March, which therefore is the best period. In particular,
January and February are quite dry, with less than 40 mm (1.6 in) per month, which is lucky for a country so rainy.
In Langkawi, it rains a lot from April to November, with a maximum between August and October, when rainfall exceeds 300 mm (12 in) per month, although it doesn't reach the peaks of the east coast.
In this area, it's hot even in the "winter" period, with highs around 31.5/32 °C (89 °F) in December and January, however, since in this period the wind blows from the interior, the humidity is slightly lower than in the rest of the year. From February to April the heat increases, and during the day the highest temperatures of the year are reached, sometimes even 37/38 °C (99/100 °F) in March and April.
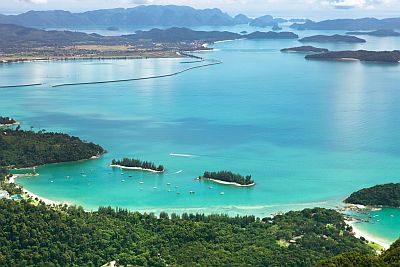
In George Town and on
Penang Island, January and February are the best months, although they are not as dry as in Langkawi, since rainfall amounts to around 70 mm (2.8 in) per month. In December and March, rainfall exceeds 100 mm (4 in) per month, and from April to November 180 mm (7 in).
Further south, in
Pangkor, even in January and February, about 150 mm (6 in) of rain fall per month, so the least rainy months here are June, July and August, however, there are no major differences with January and February.
The capital,
Kuala Lumpur, is located further south, on the west coast of the Malay Peninsula, at 3 degrees north latitude. Here too, there is no clearly dry period as well, however, the least rainy period is from
June to August, followed by January and February. Thunderstorms can erupt at any moment.
Furthermore, in the big city, the heat is more intense than elsewhere because of the so-called urban heat island effect.
Especially in August and September, the already polluted city can receive
smoke from the fires that break out on the Indonesian island of Sumatra, and which can shroud it in haze.
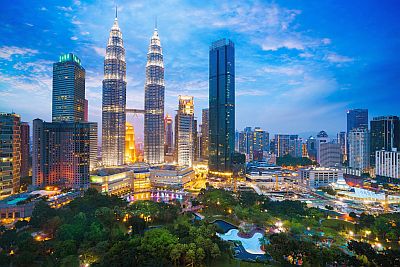
In the interior of Peninsular Malaysia too, in cities like Temerloh and Johor Bahru, the latter located just north of Singapore, the situation is similar, since the least rainy months are February, June and July, without there being a clearly preferable period.
2- Malaysian Borneo
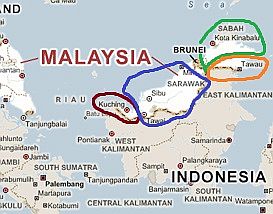
In the east, the Malaysian part of
Borneo (the largest island in Asia) is
even rainier than Peninsular Malaysia, especially in the part closest to the equator, west of Brunei (see the State of Sarawak), where precipitation exceeds 3,500 mm (137 in) per year.
Borneo is also hot all year round, and the sea is always warm enough for swimming.
The westernmost part is the rainiest (see the red area on the map), where
Kuching is located, well exposed to the north-east monsoon and therefore very rainy from October to March, with more than 300 mm (12 in) per month, and up to 670 mm (26.5 in) in January, a period when it rains almost every day. In the other months, it goes a bit better, and the rainfall goes below 300 mm (12 in) per month from May to September, which is therefore the best time (or, honestly, the least worst).
In Kuching, which is located just north of the equator, the hottest period is the least rainy one, from April to August.
Since it is not directly exposed to the north-east, the coast of Borneo to the east of Kuching and up to Miri (blue area), does not experience that extreme peak of rainfall from December to February, but otherwise, the trend is similar, with
heavy rains throughout the year. So, it being understood that there is no period with a perfect climate, the best period in this region is probably from May to July.
In
Bintulu too, the hottest period is from April to August.
East of the small country of
Brunei, in the state of Sabah and up to Kudat (green area), all in all, the best time runs from February to April. In
Labuan, a particularly rainy island, the average rainfall drops below 150 mm (6 in) from January to March.
More to the north-east, in
Kota Kinabalu, rainfall drops below 100 mm (4 in) per month in February and March.
On the northeasternmost part of the coast, in
Sandakan, directly exposed to the north-east monsoon, we find again a period with particularly heavy rains from November to February, while the least rainy period (and therefore the best one) is from April to June, however, with more than 100 mm (4 in) per month.
On average, 3,200 mm (126 in) of rain fall per year. The rains are particularly abundant especially in December and January.
In Sandakan, as in the rest of Malaysia, it is hot all year round, but especially from April to September.
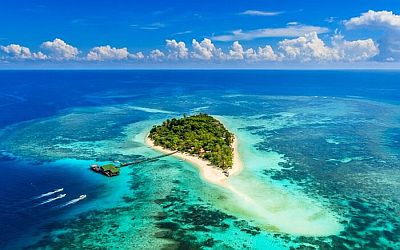
Off the coast of Sandakan, we find some
islands, including the Turtle Islands and Lankayan, where in addition to the coral reef, you can admire the green turtles, which come to lay their eggs (generally, from June to September). West of Sandakan, instead, we find the Sepilok Orangutan Rehabilitation Center.
In the south-eastern portion of Sabah, near the border with Indonesia (orange area), there is a small region which is quite sheltered, at least from the north-east monsoon: the Bay of
Lahad Datu, where less than 2,000 mm (79 in) fall per annum, with a minimum of about 150 mm (6 in) per month from June to September, and the Semporna archipelago.
Further south, near the border with the Indonesian part of Borneo, we find the city of
Tawau, where rainfall amounts to 1,930 mm (76 in) per year, even though there is no real dry month.
Mountains
In the
interior of Malaysia, there are hilly areas (called highlands), which have a slightly cooler climate and are often covered with rainforests, but there are also mountains, the highest of which is
Mount Kinabalu, located in Borneo and 4,095 meters (13,435 ft) high, while in Peninsular Malaysia, there are a few peaks that are slightly higher than 2,000 meters (6,500 feet).
The temperature obviously decreases with increasing altitude. For instance, in
Tanah Rata, which is located in the Cameron Highlands, in Peninsular Malaysia, at 1,470 meters (4,800 ft) above sea level, the daily average is around 18.5/20 °C (65/68 °F) all year long.
Cyclones, El Niño
Malaysia is located
just south of the latitude where tropical cyclones (called typhoons in the Pacific Ocean and cyclones in the Indian Ocean) form. This means that the country can be affected,
usually in a marginal way, especially in the northernmost part, and certainly not as much as the Philippines and the countries of south-east Asia.
The cyclone and typhoon season lasts from May to December, with a peak of likelihood in December. However, since the sea in this area is always warm, in theory, tropical storms may form in any season. During the Christmas period of 2001, Tropical Storm Vamei affected Peninsular Malaysia, passing at an incredibly low latitude.
Malaysia is also affected by the phenomenon known as
El Niño, which brings unusually high temperatures and drought, especially in the years when it is more intense, as happened in 1998, when water had to be rationed in Kuala Lumpur.
The opposite phenomenon,
La Niña, brings cooler temperatures than normal, and also heavy rainfall, even in periods that are normally relatively dry, as happened in 2011.
When to go
The best time to visit Malaysia as a whole is from
June to August: to tell the truth, it's everywhere a rainy period, with more than 100 mm (4 in) per month, and sometimes more than 200 mm (8 in); on the other hand, this is the climate of Malaysia and you cannot get any better. For the best times in specific areas, you can refer to the page about the climate.
The
sea is warm all year round.
What to pack
All year round: bring
tropics-friendly, loose-fitting clothing, made of natural fibers, a scarf for the breeze, a light sweatshirt for air-conditioned places, a light raincoat or umbrella.
For mid-elevation mountains, around 1,500 meters (5,000 feet), bring spring/autumn clothes, a sweatshirt and a jacket; for high mountains, warm clothes, a warm jacket, a raincoat, hiking shoes.
When going to the reef, you can bring snorkeling equipment, including water shoes or rubber-soled shoes.
Climate data - Malaysia
| Bintulu |
|---|
|
| Jan | Feb | Mar | Apr | May | Jun | Jul | Aug | Sep | Oct | Nov | Dec |
|---|
| Min temp. | 24 | 24 | 24 | 24 | 24 | 24 | 24 | 24 | 24 | 24 | 24 | 24 |
|---|
| Max temp. | 30 | 30 | 31 | 32 | 32 | 32 | 32 | 32 | 32 | 31 | 31 | 31 |
|---|
| Precip. | 460 | 300 | 280 | 275 | 235 | 245 | 250 | 300 | 305 | 370 | 425 | 455 |
|---|
| Prec. days | 18 | 14 | 13 | 15 | 13 | 14 | 13 | 13 | 15 | 18 | 20 | 20 |
|---|
| Humidity | 87% | 86% | 85% | 85% | 84% | 84% | 83% | 83% | 84% | 85% | 86% | 87% |
|---|
| Day length | 12 | 12 | 12 | 12 | 12 | 12 | 12 | 12 | 12 | 12 | 12 | 12 |
|---|
| Sun hours | 5 | 5 | 6 | 6 | 7 | 7 | 7 | 6 | 6 | 6 | 5 | 5 |
|---|
| Sea temp | 28 | 28 | 28 | 29 | 30 | 30 | 30 | 30 | 30 | 29 | 29 | 29 |
|---|
| Kota Bharu |
|---|
|
| Jan | Feb | Mar | Apr | May | Jun | Jul | Aug | Sep | Oct | Nov | Dec |
|---|
| Min temp. | 24 | 24 | 24 | 25 | 25 | 25 | 24 | 24 | 24 | 24 | 24 | 24 |
|---|
| Max temp. | 30 | 30 | 31 | 33 | 33 | 33 | 32 | 32 | 32 | 31 | 30 | 29 |
|---|
| Precip. | 150 | 70 | 140 | 90 | 115 | 140 | 155 | 160 | 165 | 265 | 675 | 570 |
|---|
| Prec. days | 10 | 5 | 7 | 6 | 8 | 10 | 10 | 12 | 12 | 16 | 20 | 18 |
|---|
| Humidity | 82% | 80% | 80% | 79% | 79% | 80% | 80% | 81% | 82% | 84% | 87% | 85% |
|---|
| Day length | 12 | 12 | 12 | 12 | 12 | 12 | 12 | 12 | 12 | 12 | 12 | 12 |
|---|
| Sun hours | 7 | 8 | 8 | 9 | 8 | 7 | 7 | 7 | 7 | 6 | 5 | 5 |
|---|
| Sea temp | 27 | 28 | 28 | 30 | 30 | 30 | 30 | 30 | 29 | 29 | 29 | 28 |
|---|
| Kota Kinabalu |
|---|
|
| Jan | Feb | Mar | Apr | May | Jun | Jul | Aug | Sep | Oct | Nov | Dec |
|---|
| Min temp. | 24 | 24 | 24 | 24 | 25 | 24 | 24 | 24 | 24 | 24 | 24 | 24 |
|---|
| Max temp. | 31 | 31 | 32 | 33 | 33 | 33 | 32 | 32 | 32 | 32 | 32 | 32 |
|---|
| Precip. | 140 | 80 | 95 | 125 | 210 | 285 | 290 | 280 | 285 | 385 | 285 | 260 |
|---|
| Prec. days | 9 | 7 | 7 | 9 | 12 | 13 | 14 | 14 | 14 | 18 | 16 | 14 |
|---|
| Humidity | 82% | 82% | 80% | 80% | 80% | 80% | 80% | 79% | 80% | 82% | 83% | 83% |
|---|
| Day length | 12 | 12 | 12 | 12 | 12 | 12 | 12 | 12 | 12 | 12 | 12 | 12 |
|---|
| Sun hours | 6 | 7 | 8 | 8 | 7 | 7 | 7 | 6 | 6 | 6 | 6 | 6 |
|---|
| Sea temp | 28 | 27 | 28 | 29 | 30 | 30 | 30 | 30 | 29 | 29 | 29 | 29 |
|---|
| Kuala Lumpur |
|---|
|
| Jan | Feb | Mar | Apr | May | Jun | Jul | Aug | Sep | Oct | Nov | Dec |
|---|
| Min temp. | 24 | 24 | 24 | 25 | 25 | 25 | 24 | 24 | 24 | 24 | 24 | 24 |
|---|
| Max temp. | 33 | 33 | 34 | 34 | 34 | 33 | 33 | 33 | 33 | 33 | 32 | 32 |
|---|
| Precip. | 225 | 195 | 270 | 300 | 230 | 145 | 165 | 175 | 220 | 285 | 355 | 280 |
|---|
| Prec. days | 14 | 12 | 15 | 17 | 13 | 10 | 11 | 11 | 13 | 16 | 20 | 16 |
|---|
| Humidity | 78% | 76% | 78% | 80% | 79% | 77% | 77% | 77% | 78% | 80% | 83% | 82% |
|---|
| Day length | 12 | 12 | 12 | 12 | 12 | 12 | 12 | 12 | 12 | 12 | 12 | 12 |
|---|
| Sun hours | 6 | 7 | 7 | 7 | 7 | 6 | 6 | 6 | 5 | 5 | 5 | 5 |
|---|
| Sea temp | 29 | 29 | 30 | 30 | 30 | 30 | 30 | 30 | 30 | 30 | 29 | 29 |
|---|
| Kuching |
|---|
|
| Jan | Feb | Mar | Apr | May | Jun | Jul | Aug | Sep | Oct | Nov | Dec |
|---|
| Min temp. | 23 | 23 | 24 | 24 | 24 | 24 | 23 | 23 | 23 | 23 | 23 | 23 |
|---|
| Max temp. | 30 | 30 | 31 | 32 | 33 | 33 | 32 | 33 | 32 | 32 | 32 | 31 |
|---|
| Precip. | 670 | 500 | 340 | 305 | 270 | 255 | 200 | 265 | 245 | 345 | 340 | 500 |
|---|
| Prec. days | 21 | 17 | 18 | 17 | 16 | 14 | 13 | 15 | 16 | 19 | 21 | 23 |
|---|
| Humidity | 87% | 86% | 85% | 85% | 84% | 83% | 81% | 81% | 84% | 85% | 86% | 87% |
|---|
| Day length | 12 | 12 | 12 | 12 | 12 | 12 | 12 | 12 | 12 | 12 | 12 | 12 |
|---|
| Sun hours | 4 | 5 | 5 | 5 | 5 | 5 | 5 | 5 | 5 | 5 | 5 | 4 |
|---|
| Sea temp | 28 | 28 | 29 | 30 | 30 | 30 | 30 | 30 | 30 | 30 | 30 | 29 |
|---|
| Langkawi |
|---|
|
| Jan | Feb | Mar | Apr | May | Jun | Jul | Aug | Sep | Oct | Nov | Dec |
|---|
| Min temp. | 25 | 25 | 26 | 26 | 26 | 26 | 25 | 25 | 25 | 25 | 25 | 25 |
|---|
| Max temp. | 32 | 33 | 33 | 32 | 32 | 32 | 31 | 31 | 31 | 31 | 31 | 31 |
|---|
| Precip. | 25 | 35 | 105 | 195 | 205 | 250 | 265 | 320 | 340 | 370 | 195 | 60 |
|---|
| Prec. days | 3 | 5 | 10 | 15 | 18 | 17 | 19 | 19 | 21 | 23 | 16 | 8 |
|---|
| Humidity | 72% | 69% | 75% | 80% | 83% | 83% | 84% | 83% | 84% | 84% | 82% | 76% |
|---|
| Day length | 12 | 12 | 12 | 12 | 12 | 12 | 12 | 12 | 12 | 12 | 12 | 12 |
|---|
| Sun hours | 8 | 9 | 8 | 8 | 7 | 7 | 7 | 6 | 6 | 6 | 6 | 7 |
|---|
| Sea temp | 28 | 29 | 29 | 30 | 30 | 30 | 30 | 30 | 29 | 29 | 29 | 29 |
|---|
| Sandakan |
|---|
|
| Jan | Feb | Mar | Apr | May | Jun | Jul | Aug | Sep | Oct | Nov | Dec |
|---|
| Min temp. | 24 | 24 | 24 | 25 | 25 | 24 | 24 | 24 | 24 | 24 | 24 | 24 |
|---|
| Max temp. | 30 | 30 | 31 | 32 | 33 | 33 | 32 | 33 | 32 | 32 | 31 | 30 |
|---|
| Precip. | 445 | 315 | 230 | 145 | 140 | 180 | 210 | 240 | 245 | 305 | 325 | 450 |
|---|
| Prec. days | 17 | 12 | 11 | 8 | 9 | 10 | 12 | 12 | 12 | 16 | 18 | 20 |
|---|
| Humidity | 85% | 83% | 82% | 81% | 81% | 81% | 81% | 80% | 81% | 83% | 85% | 86% |
|---|
| Day length | 12 | 12 | 12 | 12 | 12 | 12 | 12 | 12 | 12 | 12 | 12 | 12 |
|---|
| Sun hours | 5 | 6 | 7 | 8 | 8 | 7 | 7 | 7 | 6 | 6 | 6 | 5 |
|---|
| Sea temp | 28 | 28 | 28 | 29 | 30 | 30 | 29 | 29 | 29 | 29 | 29 | 29 |
|---|
| Tanah Rata (1,470 meters) |
|---|
|
| Jan | Feb | Mar | Apr | May | Jun | Jul | Aug | Sep | Oct | Nov | Dec |
|---|
| Min temp. | 15 | 15 | 15 | 16 | 17 | 16 | 16 | 16 | 16 | 16 | 16 | 16 |
|---|
| Max temp. | 22 | 22 | 23 | 24 | 23 | 23 | 23 | 22 | 22 | 22 | 22 | 21 |
|---|
|
|
|
|
|
| Tawau |
|---|
|
| Jan | Feb | Mar | Apr | May | Jun | Jul | Aug | Sep | Oct | Nov | Dec |
|---|
| Min temp. | 23 | 23 | 23 | 24 | 24 | 24 | 23 | 23 | 23 | 23 | 24 | 23 |
|---|
| Max temp. | 31 | 32 | 32 | 32 | 32 | 31 | 31 | 31 | 32 | 32 | 32 | 31 |
|---|
| Precip. | 145 | 105 | 125 | 125 | 165 | 175 | 190 | 210 | 135 | 170 | 170 | 215 |
|---|
| Prec. days | 11 | 9 | 10 | 9 | 12 | 12 | 12 | 11 | 10 | 13 | 13 | 15 |
|---|
| Humidity | 83% | 82% | 81% | 83% | 84% | 84% | 83% | 83% | 83% | 84% | 85% | 85% |
|---|
| Day length | 12 | 12 | 12 | 12 | 12 | 12 | 12 | 12 | 12 | 12 | 12 | 12 |
|---|
| Sun hours | 6 | 7 | 7 | 7 | 7 | 6 | 7 | 7 | 7 | 6 | 6 | 6 |
|---|
| Sea temp | 28 | 28 | 28 | 29 | 30 | 30 | 29 | 29 | 29 | 29 | 29 | 29 |
|---|
See also the
temperatures month by month