Select units of measurement for the temperature and rainfall tables (metric or imperial).
Average weather, temperature, rainfall, sunshine hours

The climate in Cao Bằng is
subtropical, with mild winters and hot, humid and rainy summers. The sun shines quite rarely.
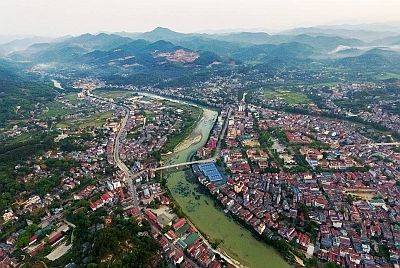
The city is located in the extreme north-east of Vietnam, at an altitude of 190 meters (625 feet), just south of the Tropic of Cancer.
About 50 km (30 mi) to the northeast, at an altitude of 360 meters (1,180 feet) and on the border with China, are the Ban Gioc waterfalls.
The
winter, from December to February, is mild, however, the sun is rarely seen, some drizzle can occur, and sometimes, fog can form at night and in the early morning. Also, sometimes there can be a bit cold periods, in fact, the temperature can drop below 5 °C (41 °F). In January 2014 it dropped to 0.4 °C (32.7 °F). In January 2016, there was a day with a maximum of 7 °C (44.5 °F).
In April and May, before the monsoon, the temperature can reach 38/39 °C (100/102 °F), but this can also happen from June to September, in periods of good weather.
The
summer, from May to September, is hot and muggy, with frequent and sometimes heavy rains.
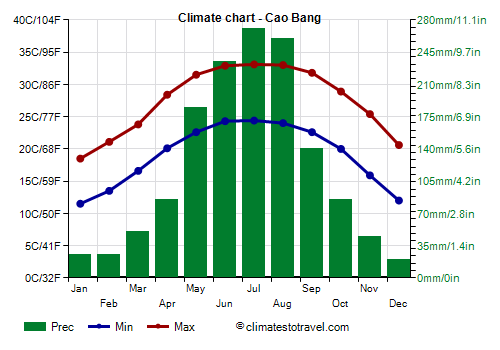
Here are the average temperatures.
Cao Bang - Average temperatures (2000-2020) |
| Month | Min | Max | Mean |
|---|
| January | 11.5 | 18.5 | 15 |
|---|
| February | 13.5 | 21.1 | 17.3 |
|---|
| March | 16.6 | 23.8 | 20.2 |
|---|
| April | 20.1 | 28.4 | 24.2 |
|---|
| May | 22.6 | 31.5 | 27 |
|---|
| June | 24.3 | 32.9 | 28.6 |
|---|
| July | 24.4 | 33.1 | 28.8 |
|---|
| August | 24 | 33 | 28.5 |
|---|
| September | 22.6 | 31.8 | 27.2 |
|---|
| October | 20 | 28.9 | 24.4 |
|---|
| November | 15.9 | 25.4 | 20.6 |
|---|
| December | 12 | 20.6 | 16.3 |
|---|
| Year | 19 | 27.4 | 23.15 |
|---|
In Cao Bang, 1,425 mm (56 in) of rain fall per year. In winter, the rains are weak but they are quite frequent, while they are abundant from May to September (and sometimes in October), during the summer monsoon period. Here is the average rainfall.
Cao Bang - Average precipitation| Month | Days |
|---|
| January | 25 | 9 |
|---|
| February | 25 | 9 |
|---|
| March | 50 | 10 |
|---|
| April | 85 | 12 |
|---|
| May | 185 | 15 |
|---|
| June | 235 | 17 |
|---|
| July | 270 | 19 |
|---|
| August | 260 | 18 |
|---|
| September | 140 | 12 |
|---|
| October | 85 | 10 |
|---|
| November | 45 | 7 |
|---|
| December | 20 | 6 |
|---|
| Year | 1425 | 144 |
|---|
Cao Bang gets just 1,500 hours of sunshine a year, with a minimum of 2 hours a day in January and February. Here are the average hours of sunshine per day.
Cao Bang - Sunshine hours| Month | Average | Total |
|---|
| January | 2 | 65 |
|---|
| February | 2 | 60 |
|---|
| March | 2.5 | 80 |
|---|
| April | 4 | 115 |
|---|
| May | 5 | 160 |
|---|
| June | 5 | 155 |
|---|
| July | 5.5 | 175 |
|---|
| August | 6 | 185 |
|---|
| September | 5.5 | 170 |
|---|
| October | 4.5 | 140 |
|---|
| November | 4 | 115 |
|---|
| December | 3.5 | 115 |
|---|
| Year | 4.2 | 1535 |
|---|
The city can be hit by
typhoons, the tropical cyclones of Southeast Asia, even though it is not on the coast, which is the area most at risk. Typically, typhoons pass in this area from June to early November.

Best Time
It is not easy to find the
best period to visit Cao Bang. Winter is mild and in theory it is the least rainy season, but there is little sun and there are frequent drizzles, moreover, it can sometimes be cold. Spring is pleasantly warm, but also gloomy, and when the sun becomes a little more frequent, thunderstorms also begin, then by May, the air becomes sultry, and there is the risk (though still low) of typhoons. In theory, autumn is the best season, but typhoons are still possible in October, while in November, there may be windy days, and at the end of the month, it can sometimes already be a bit cold. All in all, the best periods are from mid-March to mid-April, and from mid-October to late November.