Select units of measurement for the temperature and rainfall tables (metric or imperial).
Average weather, temperature, rainfall, sunshine hours
Introduction
Oregon's climate is
oceanic, cool and humid, on the coast,
semi-oceanic with hot and dry summers in the Willamette Valley, a short distance from the coast, and
arid continental in the plateau that covers the inland areas. In the inland areas, there are also low-altitude valleys and not large plain areas, in which the climate becomes
almost Mediterranean, given that the winter is mild enough and the summer is hot and sunny.
In the Cascade Range, which separates the western part influenced by the ocean and the arid eastern part, heavy snowfalls occur.
Oregon is a state in northwestern United States, located south of Washington state and north of California.
For most of the year, Oregon receives
humid ocean currents, but in summer, particularly in July and August, the weather improves because of the sub-tropical
high pressure system of the Pacific.
Oregon is therefore
sunny in summer, when the North Pacific High prevails. In the rest of the year, however, the sky is cloudy during the frequent periods in which low pressure systems dominate, however, between one disturbance and another, the sun can also come out. In some inland valleys, but also on the coast, fog can form in winter. However, the interior is a little sunnier than the coast.
Temperature and rain
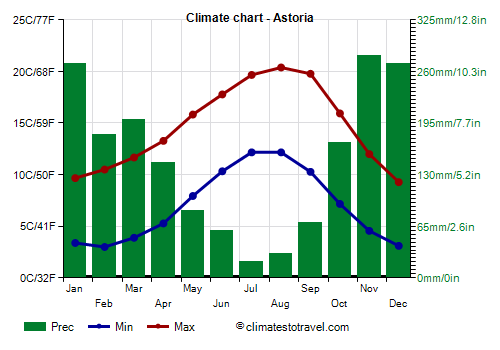
Along the
coast (see Astoria, Tillamook, Newport, Brookings), temperatures vary little between winter and summer. For example, in
Astoria, in the northern part, the average temperature ranges from 6 °C (43 °F) in December to 16 °C (61 °F) in August. So, the summer is very cool. Here are the average temperatures.
Astoria - Average temperatures (1991-2020) |
| Month | Min | Max | Mean |
|---|
| January | 3.4 | 9.7 | 6.5 |
|---|
| February | 3 | 10.5 | 6.8 |
|---|
| March | 3.9 | 11.7 | 7.8 |
|---|
| April | 5.3 | 13.3 | 9.3 |
|---|
| May | 7.9 | 15.8 | 11.9 |
|---|
| June | 10.3 | 17.8 | 14.1 |
|---|
| July | 12.2 | 19.7 | 15.9 |
|---|
| August | 12.2 | 20.4 | 16.3 |
|---|
| September | 10.3 | 19.8 | 15 |
|---|
| October | 7.2 | 15.9 | 11.6 |
|---|
| November | 4.6 | 12 | 8.3 |
|---|
| December | 3.1 | 9.3 | 6.2 |
|---|
| Year | 7 | 14.7 | 10.8 |
|---|
Rainfall is abundant, around 1,700/1,800 mm (67/71 in) per year.
Astoria - Average precipitation| Month | Days |
|---|
| January | 270 | 22 |
|---|
| February | 180 | 19 |
|---|
| March | 200 | 22 |
|---|
| April | 145 | 19 |
|---|
| May | 85 | 16 |
|---|
| June | 60 | 14 |
|---|
| July | 20 | 8 |
|---|
| August | 30 | 8 |
|---|
| September | 70 | 10 |
|---|
| October | 170 | 17 |
|---|
| November | 280 | 21 |
|---|
| December | 270 | 22 |
|---|
| Year | 1785 | 196 |
|---|
On the western side of the Oregon Coast Range, precipitation is even higher, so much so that it can reach 5,000 mm (195 in) per year. Dense forests grow in this humid area near the coast, which can be explored on trails such as
Amanda's Trail.
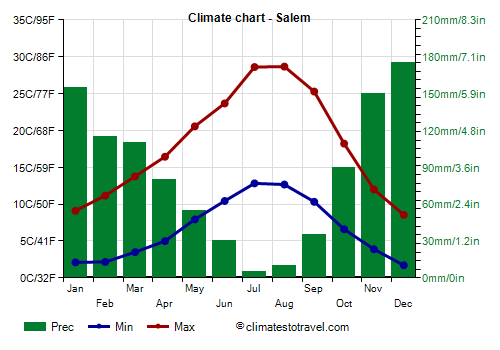
Further east, in the
Willamette Valley (see
Portland,
Salem,
Eugene), the winter is slightly colder, while the summer is definitely warmer. Typically, the temperatures are acceptable, but sometimes it can get very hot. Here are the average temperatures in Salem.
Salem - Average temperatures (1991-2020) |
| Month | Min | Max | Mean |
|---|
| January | 2.1 | 9.1 | 5.6 |
|---|
| February | 2.2 | 11.2 | 6.7 |
|---|
| March | 3.5 | 13.8 | 8.6 |
|---|
| April | 5 | 16.4 | 10.7 |
|---|
| May | 7.9 | 20.6 | 14.2 |
|---|
| June | 10.4 | 23.7 | 17.1 |
|---|
| July | 12.8 | 28.6 | 20.7 |
|---|
| August | 12.7 | 28.7 | 20.7 |
|---|
| September | 10.3 | 25.3 | 17.8 |
|---|
| October | 6.6 | 18.2 | 12.4 |
|---|
| November | 3.9 | 12 | 7.9 |
|---|
| December | 1.7 | 8.6 | 5.1 |
|---|
| Year | 6.6 | 18 | 12.3 |
|---|
Rainfall amounts to 1,000/1,200 mm (40/47 in).
Salem - Average precipitation| Month | Days |
|---|
| January | 155 | 18 |
|---|
| February | 115 | 16 |
|---|
| March | 110 | 18 |
|---|
| April | 80 | 16 |
|---|
| May | 55 | 12 |
|---|
| June | 30 | 8 |
|---|
| July | 5 | 2 |
|---|
| August | 10 | 3 |
|---|
| September | 35 | 6 |
|---|
| October | 90 | 12 |
|---|
| November | 150 | 18 |
|---|
| December | 175 | 19 |
|---|
| Year | 1020 | 148 |
|---|
In the
Cascade Range, precipitation increases again with altitude. For example, at Government Camp, 1,200 meters (3,900 ft) above sea level, at the base of Mount Hood, precipitation amounts to 2,200 mm (87 in) per year, with 6 meters and 85 cm (270 inches) of snow per year, while at Crater Lake National Park, 2,150 meters (7,000 ft) above sea level, even 14 meters (550 in) of snow fall per year. Given the amount of snow that falls, the snowline is quite low, and on the slopes of the highest mountains, it is already found at 2,100 meters (7,000 ft).
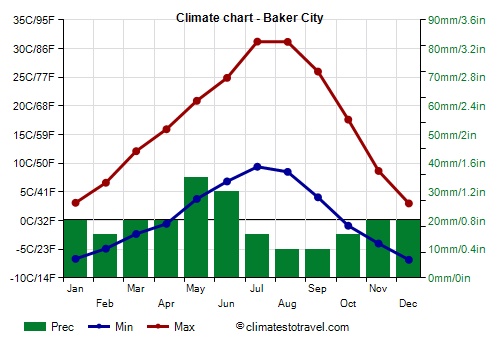
In the
central-eastern part of Oregon, largely covered by a plateau belonging to the so-called Great Basin, the climate is decidedly more continental. In winter, the average temperature drops below freezing, while in summer, there are strong variations in temperature between night and day.
For example, in
Baker City, located in the northeast at 1,000 meters (3,300 ft) above sea level, the average temperature ranges from -1.8 °C (28.8 °F) in January to 20.3 °C (68.6 °F) in July.
Baker City - Average temperatures (1991-2020) |
| Month | Min | Max | Mean |
|---|
| January | -6.7 | 3.1 | -1.8 |
|---|
| February | -4.9 | 6.6 | 0.9 |
|---|
| March | -2.3 | 12.1 | 4.9 |
|---|
| April | -0.6 | 15.9 | 7.7 |
|---|
| May | 3.8 | 20.9 | 12.3 |
|---|
| June | 6.8 | 24.9 | 15.9 |
|---|
| July | 9.4 | 31.2 | 20.3 |
|---|
| August | 8.5 | 31.2 | 19.8 |
|---|
| September | 4.1 | 26 | 15 |
|---|
| October | -0.9 | 17.6 | 8.4 |
|---|
| November | -4 | 8.7 | 2.3 |
|---|
| December | -6.8 | 3 | -1.9 |
|---|
| Year | 0.6 | 16.8 | 8.65 |
|---|
The center-east of Oregon, which as mentioned is largely covered by a plateau, is
arid, because the humid currents from the Pacific have discharged most of the rains on the western side and on the mountains. For this reason, precipitation is often lower than 300 mm (12 in) per year, as happens for example in
Hermiston, Baker City,
Bend,
Ontario. However, given that the winter is cold, it can sometimes snow.
Baker City - Average precipitation| Month | Days |
|---|
| January | 20 | 10 |
|---|
| February | 15 | 8 |
|---|
| March | 20 | 10 |
|---|
| April | 20 | 10 |
|---|
| May | 35 | 10 |
|---|
| June | 30 | 8 |
|---|
| July | 15 | 4 |
|---|
| August | 10 | 3 |
|---|
| September | 10 | 4 |
|---|
| October | 15 | 6 |
|---|
| November | 20 | 9 |
|---|
| December | 20 | 11 |
|---|
| Year | 230 | 94 |
|---|
There is also an area where precipitation drops below 200 mm (8 in) per year, such as the Alvord Desert, a valley at 1,200 meters (3,900 ft) above sea level, located in the south of the state, near the border with California.
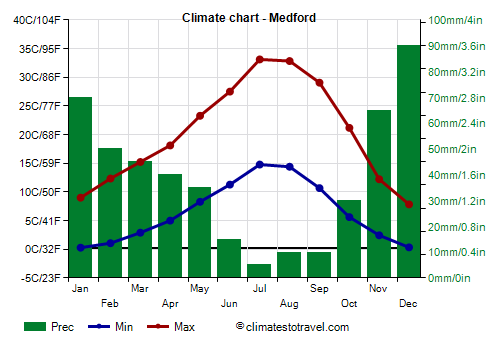
In
inland areas at low altitude, the summer is decidedly hot, and on the hottest days of the year, the temperature can exceed 40 °C (104 °F). In
Medford, located in the south, in a valley, at 400 meters (1,300 ft) above sea level, the maximum temperatures in July and August are around 33 °C (91.5 °F).
Medford - Average temperatures (1991-2020) |
| Month | Min | Max | Mean |
|---|
| January | 0.3 | 9 | 4.6 |
|---|
| February | 1.1 | 12.3 | 6.7 |
|---|
| March | 2.9 | 15.2 | 9.1 |
|---|
| April | 5 | 18.1 | 11.6 |
|---|
| May | 8.3 | 23.3 | 15.8 |
|---|
| June | 11.3 | 27.5 | 19.4 |
|---|
| July | 14.8 | 33.1 | 23.9 |
|---|
| August | 14.4 | 32.8 | 23.6 |
|---|
| September | 10.7 | 29.1 | 19.9 |
|---|
| October | 5.6 | 21.2 | 13.4 |
|---|
| November | 2.4 | 12.2 | 7.3 |
|---|
| December | 0.3 | 7.8 | 4.1 |
|---|
| Year | 6.5 | 20.2 | 13.3 |
|---|
Sea temperature
The Pacific Ocean along the Oregon coast is cold all year round. The ocean temperature fluctuates between 9 °C and 14.5 °C (48 °F and 58 °F) in the north and between 11 °C and 14 °C (52 °C and 57 °C) in the south. Here are the average sea temperatures in Astoria, in the northern part.
Astoria - Sea temperature| Month |
|---|
| January | 9 |
|---|
| February | 9 |
|---|
| March | 9.5 |
|---|
| April | 10 |
|---|
| May | 11.5 |
|---|
| June | 13 |
|---|
| July | 14.5 |
|---|
| August | 14.5 |
|---|
| September | 14.5 |
|---|
| October | 13 |
|---|
| November | 11"> |
|---|
| December | 10 |
|---|
| Year | 11.6 |
|---|
Mountains
In Oregon we find some
mountain ranges. A short distance from the coast we find a chain of hills and low mountains, the Oregon Coast Range, whose highest peak is Marys Peak, 1,250 meters (4,100 ft) high. To the south, on the border with California, the Coast Range continues and widens in the Klamath Mountains, which are higher especially in California, where it exceeds 2,500 meters or 8,200 ft (in Oregon it reaches 1,600 meters or 5,250 ft). The area is protected in the
Rogue River – Siskiyou National Forest.
At 150/200 km (95/125 mi) away from the coast, and parallel to it, we find the Cascade Range. Mount Hood, 3,425 meters (11,237 ft) high, is Oregon's highest peak. Other high peaks are Mount Jefferson (3,201 meters or 10,502 ft), and the highest of the "Three Sisters", the South Sister (3,185 meters or 10,499 ft). In the south, we find the
Crater Lake National Park, where there is a lake that occupies a caldera formed by the explosion of a volcano that took place 7,700 years ago.
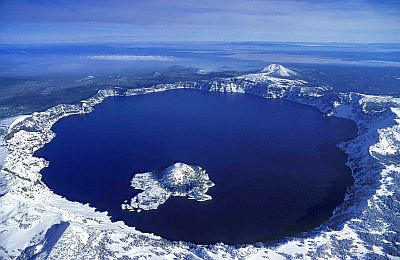
In addition to the Cascade Range, in the north-east, we have a group of mountain ranges called Blue Mountains, which reach 3,000 meters (9,800 ft) in Matterhorn and in Sacajawea peak, both of which are located in the chain called Wallowa Mountains.
Waves of cold and heat
Even though it is located west of the Rockies, and therefore has a milder climate than the interior, occasionally, in winter, Oregon can be affected by
polar cold waves, during which the temperature can drop below -20 °C (-4 °F) in inland areas. In this northwestern part of the United States, cold spells sometimes occur early, as early as mid-November (as happened in 1985 and 2014). However, a very intense cold waves was that of the Christmas period of 1990, when the temperature dropped to -32.7 °C (-27 °F) in Rome, -32 °C (-25.5 °F) in Baker City, -31 °C (-24 °F) in Redmond, -20.7 °C (-5 °F) in The Dalles, -20 °C (-4 °F) in Medford, and -14.4 °C (6 °F) in Astoria. Another one occurred in February 1989, when the temperature dropped to -13 °C (8.5 °F) in Portland and Astoria, -18.3 °C (-1 °F) in Salem, -15.6 °C (4 °F) in Eugene, -33 °C (-27.5 °F) in Baker City, -28.4 °C (-19 °F) in Redmond, and -20 °C (-4 °F) in The Dalles.
In summer, on the other hand, there may be
heat waves. In these cases, the highest temperatures in Oregon are recorded in inland areas and at low altitudes. In the north, the Columbia River Valley is the only plain area among those found far from the coast. Here, in 2015, the temperature reached 43 °C (109.5 °F) in The Dalles and 44 °C (111 °F) in Hermiston, but it also reached 43 °C (109.5 °F) in Pendleton, which is located nearby but at 450 meters (1,500 ft) above sea level, and in Ontario, in the east, 650 meters (2,100 ft) above sea level, on the border with Idaho. In the Willamette Valley, the temperature reaches somewhat lower values, but it can still get very hot. In 2015, the temperature reached 39 °C (102 °F) in Portland, and 40.6 °C (105 °F) in Salem and Eugene, while in Astoria, on the coast, it did not go above 32 °C (89.5 °F).
In the south, the altitude goes down to 300/400 meters (1,000/1,300 ft) in the Rogue River Valley (see Grants Pass, Medford), which is isolated from the ocean by the Klamath Mountains. In Medford, 400 meters (1,300 ft) above sea level, the temperature reached 43 °C (109.5 °F) in 2015, and up to 45.5 °C (114 °F) in 1981.
In
late June 2021, during an exceptional heat wave that hit the northwest of the United States and the southwest of Canada, in Hermiston and The Dalles the state record was beatn with 48 °C (118 °C), in addition, the temperature reached 47 °C (116.5 °F) in Pendleton, Portland and Salem, 46 °C (115 °F) in Medford, 44 °C (111 °F) in Eugene, and 38 °C (100.5 °F) in Astoria.
Best Time
Along the coast and in the mountains, the best time is the summer, as it is the mildest and driest of the year. In the Willamette Valley and especially in the arid areas of the central-east, where in summer it can be very hot, you can choose the intermediate seasons.
See also the
temperatures by month.