Select units of measurement for the temperature and rainfall tables (metric or imperial).
Average weather, temperature, rainfall, sunshine hours

The climate of Hermiston is
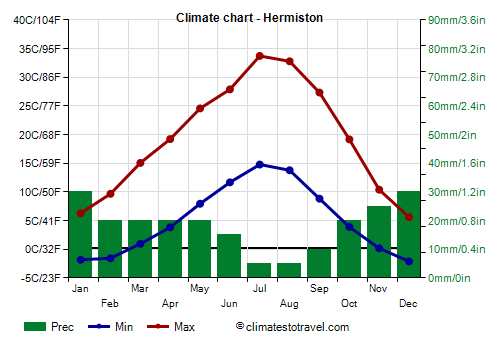
arid continental, with cold winters and hot summers. The scarce rainfall occurs in the cold semester, while the summer is sunny.
The city is located in northeastern
Oregon, 150 meters (500 feet) above sea level. A short distance away we find the city of Pendleton.
In
winter, cold waves are possible, during which the temperature can drop to -20 °C (-4 °F) or even below. Snowfall is quite frequent, but generally not abundant.
In
summer, there are several very hot days. On the hottest days of the year, the temperature generally reaches 39/40 °C (102/104 °F), but sometimes even higher.
At the end of June 2021, in The Dalles and Hermiston, during an exceptional heat wave, the temperature reached 47.8 °C (118 °F), a value that represents the record of the entire state of Oregon.

Best Time
The best times to visit Hermiston are spring and autumn, and in particular the months of May and September, to avoid both the winter cold and the summer heat.
Hermiston - Climate data
In Hermiston, the
average temperature of the coldest month (December) is of
1.8 °C, that of the warmest month (July) is of
24.2 °C. Here are the average temperatures.
Hermiston - Average temperatures (1991-2020) |
| Month | Min | Max | Mean |
|---|
| January | -1.8 | 6.3 | 2.2 |
|---|
| February | -1.6 | 9.7 | 4.1 |
|---|
| March | 0.9 | 15.1 | 8 |
|---|
| April | 3.8 | 19.2 | 11.5 |
|---|
| May | 7.9 | 24.6 | 16.2 |
|---|
| June | 11.7 | 27.9 | 19.8 |
|---|
| July | 14.8 | 33.7 | 24.2 |
|---|
| August | 13.8 | 32.8 | 23.3 |
|---|
| September | 8.8 | 27.3 | 18.1 |
|---|
| October | 3.9 | 19.2 | 11.5 |
|---|
| November | 0.2 | 10.4 | 5.3 |
|---|
| December | -2.1 | 5.6 | 1.8 |
|---|
| Year | 5.1 | 19.4 | 12.2 |
|---|
amounts to
220 millimeters per year: it is therefore scarce. It ranges from
5 millimeters in the driest months (July, August) to
30 millimeters in the wettest ones (January, December) Here is the average precipitation.
Hermiston - Average precipitation| Month | Days |
|---|
| January | 30 | 10 |
|---|
| February | 20 | 8 |
|---|
| March | 20 | 8 |
|---|
| April | 20 | 6 |
|---|
| May | 20 | 8 |
|---|
| June | 15 | 5 |
|---|
| July | 5 | 2 |
|---|
| August | 5 | 2 |
|---|
| September | 10 | 3 |
|---|
| October | 20 | 8 |
|---|
| November | 25 | 10 |
|---|
| December | 30 | 10 |
|---|
| Year | 220 | 80 |
|---|