![]() Climate chart - Baker City (Oregon)
Climate chart - Baker City (Oregon)
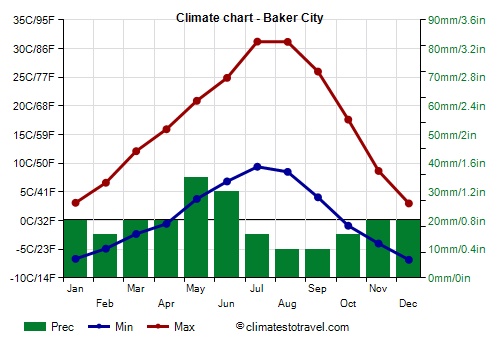
The climate of Baker City is
arid continental, with very cold winters and hot summers, and with strong temperature variations between night and day.
The town is located in northeastern Oregon, at 1,000 meters (3,300 feet) above sea level, in the western American plateau called Great Basin.
During
winter, cold snaps are possible, during which the temperature can drop to -30 °C (-22 °F). In February 1989, it dropped to -33 °C (-27.5 °F). Snowfalls are generally not abundant, but they are quite frequent. In an average year, 67 cm (26 in) of snow fall.
In
summer, there are strong temperature variations between night and day. At night, it can be cold even in the height of summer. However, on the hottest days of the year, the temperature can reach 38/39 °C (100/102 °F).
The
average temperature of the coldest month (December) is of -1.9 °C (28.6 °F), that of the warmest month (July) is of 20.3 °C (68.5 °F). Here are the average temperatures.
Baker City - Average temperatures (1991-2020) | Month | Min (°C) | Max (°C) | Mean (°C) | Min (°F) | Max (°F) | Mean (°F) |
|---|
| January | -6.7 | 3.1 | -1.8 | 20 | 38 | 28.8 |
|---|
| February | -4.9 | 6.6 | 0.9 | 23 | 44 | 33.5 |
|---|
| March | -2.3 | 12.1 | 4.9 | 28 | 54 | 40.8 |
|---|
| April | -0.6 | 15.9 | 7.7 | 31 | 61 | 45.8 |
|---|
| May | 3.8 | 20.9 | 12.3 | 39 | 70 | 54.2 |
|---|
| June | 6.8 | 24.9 | 15.9 | 44 | 77 | 60.5 |
|---|
| July | 9.4 | 31.2 | 20.3 | 49 | 88 | 68.5 |
|---|
| August | 8.5 | 31.2 | 19.8 | 47 | 88 | 67.7 |
|---|
| September | 4.1 | 26 | 15 | 39 | 79 | 59.1 |
|---|
| October | -0.9 | 17.6 | 8.4 | 30 | 64 | 47 |
|---|
| November | -4 | 8.7 | 2.3 | 25 | 48 | 36.2 |
|---|
| December | -6.8 | 3 | -1.9 | 20 | 37 | 28.6 |
|---|
| Year | 0.6 | 16.8 | 8.65 | 33 | 62.3 | 47.5 |
|---|
amounts to 230 millimeters (9.1 inches) per year: it is therefore scarce. It ranges from 10 mm (0.4 in) in the driest months (August, September) to 35 mm (1.4 in) in the wettest (May). Here is the average precipitation.
Baker City - Average precipitation| Month | Millimeters | Inches | Days |
|---|
| January | 20 | 0.8 | 10 |
|---|
| February | 15 | 0.6 | 8 |
|---|
| March | 20 | 0.8 | 10 |
|---|
| April | 20 | 0.8 | 10 |
|---|
| May | 35 | 1.4 | 10 |
|---|
| June | 30 | 1.2 | 8 |
|---|
| July | 15 | 0.6 | 4 |
|---|
| August | 10 | 0.4 | 3 |
|---|
| September | 10 | 0.4 | 4 |
|---|
| October | 15 | 0.6 | 6 |
|---|
| November | 20 | 0.8 | 9 |
|---|
| December | 20 | 0.8 | 11 |
|---|
| Year | 230 | 9.1 | 94 |
|---|

Best Time
To visit Baker City, you can choose the months of May and September. It is true that it rains a little more often than in summer (especially in May), and that it gets colder at night, but in this way, you can avoid the heat that can occur in summer. September is probably the best month.
Back to the climate of
Oregon.
Baker City - Weather by month
Based on the period 1991-2020
January is generally a very cold month. The average temperature is of -1.8 °C (29 °F), with a minimum of -6.7 °C (20 °F) and a maximum of 3.1 °C (37.6 °F).

On the coldest nights of the month, the temperature usually drops to around -19 °C (-2 °F). However, it dropped to -31.1 °C (-24 °F) in January 2017.

On the warmest days of the month, the temperature usually reaches around 8.5 °C (47.5 °F). However, it reached 16.1 °C (61 °F) in January 2003.

Precipitation amounts to 20 mm (0.8 in), distributed over 10 days.
The day lasts on average 9 hours and 20 minutes.
The average humidity is 81%. Hence, the air is normally humid.
The average wind speed is 10 kph (6 mph).
February is generally a cold month. The average temperature is of 0.9 °C (34 °F), with a minimum of -4.9 °C (23.2 °F) and a maximum of 6.6 °C (43.9 °F).
On the coldest nights of the month, the temperature usually drops to around -15 °C (5.5 °F). However, it dropped to -27.3 °C (-17.1 °F) in February 1996.
On the warmest days of the month, the temperature usually reaches around 12.5 °C (54 °F). However, it reached 18.3 °C (64.9 °F) in February 1995.
Precipitation amounts to 15 mm (0.6 in), distributed over 8 days.
The day lasts on average 10 hours and 30 minutes.
The average humidity is 75%. Hence, the air is normally humid.
The average wind speed is 11 kph (7 mph).
March is generally a quite cold month. However, there are remarkable differences between night and day. The average temperature is of 4.9 °C (41 °F), with a minimum of -2.3 °C (27.8 °F) and a maximum of 12.1 °C (53.8 °F).
On the coldest nights, which normally occur at the beginning of the month, the temperature usually drops to around -10 °C (14 °F). However, it dropped to -17 °C (1.4 °F) in March 2008.
On the warmest days, which normally occur at the end of the month, the temperature usually reaches around 19.5 °C (67 °F). However, it reached 24.4 °C (75.9 °F) in March 1994.
Precipitation amounts to 20 mm (0.8 in), distributed over 10 days.
The day lasts on average 12 hours and 0 minutes.
The average humidity is 65%.
The average wind speed is 12 kph (8 mph).
April is generally a quite mild month. However, there are remarkable differences between night and day. The average temperature is of 7.7 °C (46 °F), with a minimum of -0.6 °C (31 °F) and a maximum of 15.9 °C (60.7 °F).
On the coldest nights, which normally occur at the beginning of the month, the temperature usually drops to around -8 °C (18 °F). However, it dropped to -11.1 °C (12 °F) in April 2013.
On the warmest days, which normally occur at the end of the month, the temperature usually reaches around 24.5 °C (76.5 °F). However, it reached 29.4 °C (84.9 °F) in April 2012.
Precipitation amounts to 20 mm (0.8 in), distributed over 10 days.
The day lasts on average 13 hours and 35 minutes.
The average humidity is 59%.
The average wind speed is 13 kph (8 mph).
May is generally a mild month. However, there are remarkable differences between night and day. The average temperature is of 12.3 °C (54 °F), with a minimum of 3.8 °C (38.8 °F) and a maximum of 20.9 °C (69.6 °F).
On the coldest nights, which normally occur at the beginning of the month, the temperature usually drops to around -5 °C (23 °F). However, it dropped to -9.4 °C (15.1 °F) in May 2013.
On the warmest days, which normally occur at the end of the month, the temperature usually reaches around 29.5 °C (85 °F). However, it reached 34.4 °C (93.9 °F) in May 2020.
Precipitation amounts to 35 mm (1.4 in), distributed over 10 days.
The day lasts on average 14 hours and 55 minutes. So the days are long.
The average humidity is 58%.
The average wind speed is 12 kph (8 mph).
June is generally a very mild month. However, there are remarkable differences between night and day. The average temperature is of 15.9 °C (61 °F), with a minimum of 6.8 °C (44.3 °F) and a maximum of 24.9 °C (76.8 °F).
On the coldest nights, which normally occur at the beginning of the month, the temperature usually drops to around 0 °C (32 °F). However, it dropped to -2.8 °C (27 °F) in June 1996.
On the warmest days, which normally occur at the end of the month, the temperature usually reaches around 33 °C (91.5 °F). However, it reached 37.7 °C (99.9 °F) in June 1992.
Precipitation amounts to 30 mm (1.2 in), distributed over 8 days.
The day lasts on average 15 hours and 30 minutes. So the days are long. June 21, the summer solstice, is the longest day of the year in the Northern Hemisphere.
The average humidity is 56%.
The average wind speed is 12 kph (7 mph).
July, the warmest month of the year, is generally a warm month. However, there are remarkable differences between night and day. The average temperature is of 20.3 °C (69 °F), with a minimum of 9.4 °C (48.9 °F) and a maximum of 31.2 °C (88.2 °F).
On the coldest nights of the month, the temperature usually drops to around 3 °C (37.5 °F). However, it dropped to 0 °C (32 °F) in July 1999.
On the warmest days of the month, the temperature usually reaches around 37 °C (98.5 °F). However, it reached 40.6 °C (105.1 °F) in July 2020.
Precipitation amounts to 15 mm (0.6 in), distributed over 4 days.
The day lasts on average 15 hours and 5 minutes. So the days are long.
The average humidity is 47%.
The average wind speed is 10 kph (6 mph).
August is generally a warm month. However, there are remarkable differences between night and day. The average temperature is of 19.8 °C (68 °F), with a minimum of 8.5 °C (47.3 °F) and a maximum of 31.2 °C (88.1 °F).
On the coldest nights of the month, the temperature usually drops to around 2 °C (36 °F). However, it dropped to -2.8 °C (27 °F) in August 1992.
On the warmest days of the month, the temperature usually reaches around 36.5 °C (98 °F). However, it reached 42.8 °C (109 °F) in August 2018.
Precipitation amounts to 10 mm (0.4 in), distributed over 3 days.
The day lasts on average 13 hours and 55 minutes.
The average humidity is 46%.
The average wind speed is 10 kph (6 mph).
September is generally a very mild month. However, there are remarkable differences between night and day. The average temperature is of 15.0 °C (59 °F), with a minimum of 4.1 °C (39.3 °F) and a maximum of 26 °C (78.8 °F).
On the coldest nights, which normally occur at the end of the month, the temperature usually drops to around -3.5 °C (26 °F). However, it dropped to -7.3 °C (18.9 °F) in September 1999.
On the warmest days, which normally occur at the beginning of the month, the temperature usually reaches around 34 °C (93 °F). However, it reached 38.9 °C (102 °F) in September 2017.
Precipitation amounts to 10 mm (0.4 in), distributed over 4 days.
The day lasts on average 12 hours and 25 minutes.
The average humidity is 51%.
The average wind speed is 9 kph (6 mph).
October is generally a quite mild month. However, there are remarkable differences between night and day. The average temperature is of 8.4 °C (47 °F), with a minimum of -0.9 °C (30.4 °F) and a maximum of 17.6 °C (63.7 °F).
On the coldest nights, which normally occur at the end of the month, the temperature usually drops to around -9.5 °C (15.5 °F). However, it dropped to -16.1 °C (3 °F) in October 2002.
On the warmest days, which normally occur at the beginning of the month, the temperature usually reaches around 26.5 °C (79.5 °F). However, it reached 32.2 °C (90 °F) in October 1992.
Precipitation amounts to 15 mm (0.6 in), distributed over 6 days.
The day lasts on average 10 hours and 55 minutes.
The average humidity is 61%.
The average wind speed is 9 kph (6 mph).
November is generally a cold month. The average temperature is of 2.3 °C (36 °F), with a minimum of -4 °C (24.8 °F) and a maximum of 8.7 °C (47.6 °F).
On the coldest nights, which normally occur at the end of the month, the temperature usually drops to around -14 °C (6.5 °F). However, it dropped to -22.8 °C (-9 °F) in November 1993.
On the warmest days, which normally occur at the beginning of the month, the temperature usually reaches around 17 °C (62 °F). However, it reached 22.2 °C (72 °F) in November 1999.
Precipitation amounts to 20 mm (0.8 in), distributed over 9 days.
The day lasts on average 9 hours and 30 minutes.
The average humidity is 73%. Hence, the air is normally humid.
The average wind speed is 11 kph (7 mph).
December, the coldest month of the year, is generally a very cold month. The average temperature is of -1.9 °C (29 °F), with a minimum of -6.8 °C (19.7 °F) and a maximum of 3 °C (37.4 °F).
On the coldest nights of the month, the temperature usually drops to around -18 °C (-0.5 °F). However, it dropped to -28.9 °C (-20 °F) in December 2016.
On the warmest days of the month, the temperature usually reaches around 10 °C (50 °F). However, it reached 15.5 °C (59.9 °F) in December 1995.
Precipitation amounts to 20 mm (0.8 in), distributed over 11 days.
The day lasts on average 8 hours and 55 minutes. December 21, the winter solstice, is the shortest day of the year in the Northern Hemisphere.
The average humidity is 80%. Hence, the air is normally humid.
The average wind speed is 11 kph (7 mph).