Select units of measurement for the temperature and rainfall tables (metric or imperial).
Average weather, temperature, rainfall, sunshine hours
Index
Introduction
In Texas, a large southern U.S. state, the climate is continental in the northwest, where we find a plateau, and
subtropical in the rest of the state.
If the north-west is excluded,
winter is mild, but short bursts of cold air are possible. In the plains, snowfalls are rare in the northern part (see Dallas) and very rare in the central-southern part.
Summer is very hot in the lowlands, and muggy especially in the eastern part and along the coast of the Gulf of Mexico, while it is drier in the west (and less hot at high altitudes).
As far as
rainfall is concerned, the western part of Texas (see Amarillo, Lubbock, El Paso) is arid, while the eastern part (see Houston, Beaumont), where rainfall exceeds 1,200 mm (47 in) per year, is rainy. The central belt, where we find cities like Dallas, Austin, San Antonio, Corpus Christi, and where from 750 to 850 mm (29.5/33.5 in) of rain fall per year, is at an intermediate position, in fact it can receive either dry air masses from the west or moist air masses from the east, and there can be dry as well as very rainy periods.
Texas is a sunny state. The
sun shines all year round, especially in the western desert areas. In El Paso, in the far west, there are even 3,750 hours of sunshine per year, and in Amarillo, in the north-west, around 3,300. The least sunny area is the south-eastern one, around the Gulf of Mexico (see Austin, San Antonio, Houston), where it drops to 2,600 hours of sunshine per year, and the sun shines roughly half the time in winter and 3/4 of the time in summer.
West
In the
northwest, occupied by a plateau (see Amarillo,
Lubbock), in winter there are strong variations in temperature between the night, when it normally falls below freezing, and the day, when the air becomes mild. But sometimes there can be cold waves, with snowfalls and severe frosts. The temperature can drop to -20 °C (-4 °F) or even below.
Summer is torrid during the day, with highs that can reach or exceed 40 °C (104 °F), and with some thunderstorms. Precipitation amounts to 450/500 mm (15/20 in) per year. Winter is the driest season. The sun shines all year round.
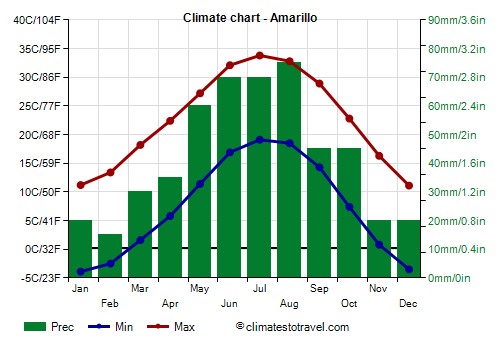
In
Amarillo, the average temperature ranges from 3.5 °C (38.5 °F) in January to 26.5 °C (79.5 °F) in July.
Amarillo - Average temperatures (1991-2020) |
| Month | Min | Max | Mean |
|---|
| January | -3.9 | 11.2 | 3.6 |
|---|
| February | -2.5 | 13.4 | 5.4 |
|---|
| March | 1.6 | 18.2 | 9.9 |
|---|
| April | 5.8 | 22.4 | 14.1 |
|---|
| May | 11.4 | 27.2 | 19.3 |
|---|
| June | 16.9 | 32.1 | 24.5 |
|---|
| July | 19.1 | 33.8 | 26.4 |
|---|
| August | 18.5 | 32.8 | 25.6 |
|---|
| September | 14.3 | 28.9 | 21.6 |
|---|
| October | 7.4 | 22.8 | 15.1 |
|---|
| November | 0.8 | 16.3 | 8.6 |
|---|
| December | -3.5 | 11.1 | 3.8 |
|---|
| Year | 7.2 | 22.6 | 14.85 |
|---|
Precipitation amounts to about 500 millimeters (20 inches) per year.
Amarillo - Average precipitation| Month | Days |
|---|
| January | 20 | 4 |
|---|
| February | 15 | 4 |
|---|
| March | 30 | 6 |
|---|
| April | 35 | 6 |
|---|
| May | 60 | 7 |
|---|
| June | 70 | 8 |
|---|
| July | 70 | 7 |
|---|
| August | 75 | 8 |
|---|
| September | 45 | 6 |
|---|
| October | 45 | 5 |
|---|
| November | 20 | 4 |
|---|
| December | 20 | 4 |
|---|
| Year | 500 | 69 |
|---|
Continuing south, the climate becomes progressively warmer and drier.
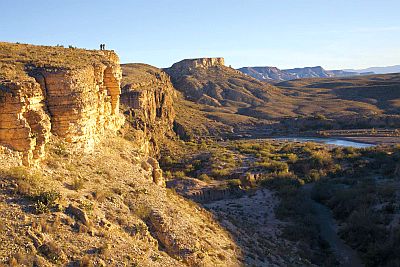
The southwestern part of Texas, near the border with Mexico, along the Rio Grande river (see Big Bend,
El Paso), is occupied by a portion of the
Chihuahua desert, where from July through September some rain can occur. In winter, short cold waves are still possible, although less intense and frequent than in the north-west.
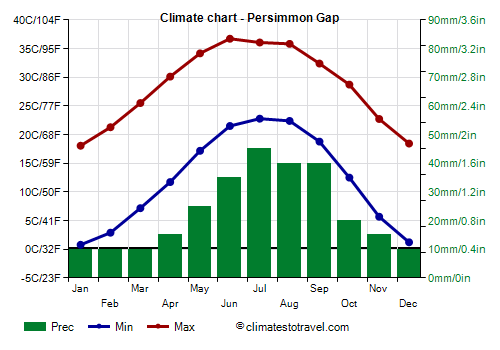
At the Persimmon Gap, located in the
Big Bend National Park, at 900 meters (2,950 feet) above sea level, the average temperature ranges from 9.5 °C (49 °F) in January to 29.5 °C (85 °F) in July.
Persimmon Gap - Average temperatures (1991-2020) |
| Month | Min | Max | Mean |
|---|
| January | 0.8 | 18.1 | 9.4 |
|---|
| February | 2.9 | 21.3 | 12.1 |
|---|
| March | 7.2 | 25.5 | 16.3 |
|---|
| April | 11.7 | 30.1 | 20.9 |
|---|
| May | 17.2 | 34.2 | 25.7 |
|---|
| June | 21.5 | 36.7 | 29.1 |
|---|
| July | 22.8 | 36.1 | 29.4 |
|---|
| August | 22.4 | 35.8 | 29.1 |
|---|
| September | 18.8 | 32.4 | 25.6 |
|---|
| October | 12.5 | 28.7 | 20.6 |
|---|
| November | 5.7 | 22.7 | 14.2 |
|---|
| December | 1.2 | 18.4 | 9.8 |
|---|
| Year | 12.1 | 28.4 | 20.2 |
|---|
In Big Bend, rainfall is practically desert-like, at least at lower altitudes, although some thunderstorms can occur in summer.
Persimmon Gap - Average precipitation| Month | Days |
|---|
| January | 10 | 3 |
|---|
| February | 10 | 2 |
|---|
| March | 10 | 2 |
|---|
| April | 15 | 2 |
|---|
| May | 25 | 5 |
|---|
| June | 35 | 5 |
|---|
| July | 45 | 5 |
|---|
| August | 40 | 6 |
|---|
| September | 40 | 5 |
|---|
| October | 20 | 4 |
|---|
| November | 15 | 3 |
|---|
| December | 10 | 3 |
|---|
| Year | 275 | 46 |
|---|
Center-east
The central-eastern portion of Texas is flat. Winter is quite cold in the far north, and becomes progressively milder as you go south. Summer is very hot, with highs that can exceed 40 °C (104 °F), and sultry. The rains are more abundant than in the west, due to the influence of humid currents from the Gulf of Mexico.
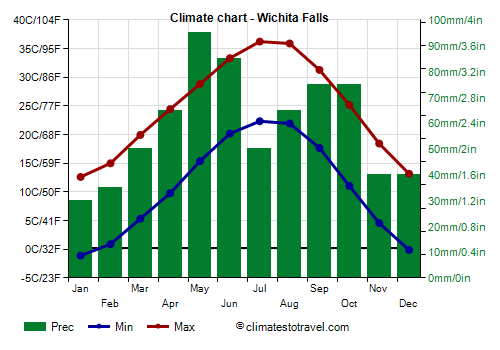
In the far north, in
Wichita Falls, 300 meters (950 feet) above sea level, near the border with Oklahoma, lows in December and January are even below freezing, and sometimes they can go down to -20 °C (-4 °F). In summer, on the other hand, the maximum temperatures are around 36 °C (97 °F) in July and August.
Wichita Falls - Average temperatures (1991-2020) |
| Month | Min | Max | Mean |
|---|
| January | -1.1 | 12.6 | 5.8 |
|---|
| February | 0.9 | 15 | 7.9 |
|---|
| March | 5.3 | 19.9 | 12.6 |
|---|
| April | 9.8 | 24.4 | 17.1 |
|---|
| May | 15.4 | 28.8 | 22.1 |
|---|
| June | 20.2 | 33.3 | 26.8 |
|---|
| July | 22.3 | 36.2 | 29.3 |
|---|
| August | 21.9 | 35.9 | 28.9 |
|---|
| September | 17.7 | 31.3 | 24.5 |
|---|
| October | 11.1 | 25.2 | 18.1 |
|---|
| November | 4.6 | 18.4 | 11.5 |
|---|
| December | -0.1 | 13.2 | 6.5 |
|---|
| Year | 10.7 | 24.6 | 17.6 |
|---|
In Wichita Falls, 710 mm (28 in) of rain fall per year. In winter, an average of 10 cm (3.4 in) of snow falls.
Wichita Falls - Average precipitation| Month | Days |
|---|
| January | 30 | 5 |
|---|
| February | 35 | 5 |
|---|
| March | 50 | 6 |
|---|
| April | 65 | 7 |
|---|
| May | 95 | 9 |
|---|
| June | 85 | 7 |
|---|
| July | 50 | 5 |
|---|
| August | 65 | 6 |
|---|
| September | 75 | 6 |
|---|
| October | 75 | 7 |
|---|
| November | 40 | 5 |
|---|
| December | 40 | 4 |
|---|
| Year | 710 | 73 |
|---|
South of Wichita Falls, but still in northern Texas, (see
Dallas, Fort Worth), winter nights are still quite cold, and frosts are not that rare.
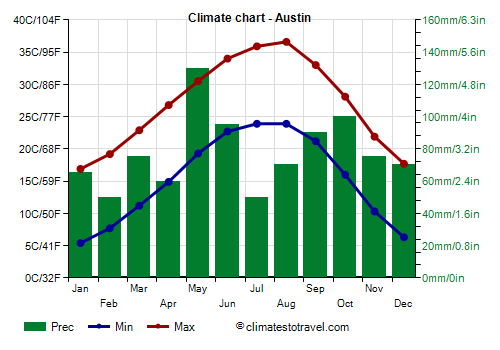
Further south, the winter becomes milder, so much so that in
Austin (the state capital),
San Antonio and
Houston, the average in January exceeds 10 °C (50 °F). However, even here there can be cold waves, with temperatures that can drop to -10 °C (14 °F) or even below.
Here are the average temperatures in Austin.
Austin - Average temperatures (1991-2020) |
| Month | Min | Max | Mean |
|---|
| January | 5.4 | 16.9 | 11.1 |
|---|
| February | 7.7 | 19.2 | 13.4 |
|---|
| March | 11.2 | 22.9 | 17 |
|---|
| April | 14.9 | 26.8 | 20.8 |
|---|
| May | 19.3 | 30.5 | 24.9 |
|---|
| June | 22.7 | 34 | 28.4 |
|---|
| July | 23.9 | 35.9 | 29.9 |
|---|
| August | 23.9 | 36.6 | 30.2 |
|---|
| September | 21.2 | 33 | 27.1 |
|---|
| October | 16 | 28.1 | 22 |
|---|
| November | 10.3 | 21.9 | 16.1 |
|---|
| December | 6.3 | 17.7 | 12 |
|---|
| Year | 15.3 | 27 | 21.1 |
|---|

Summer is still very hot, although along the coast, it becomes a little less hot, but on the other hand it is even more sultry. In
Galveston, located on the coast, southeast of Houston, the daily average in July and August is around 30 °C (86 °F), but with a smaller temperature range, and with slightly lower maximum, around 33 °C (91.5 °F).
South
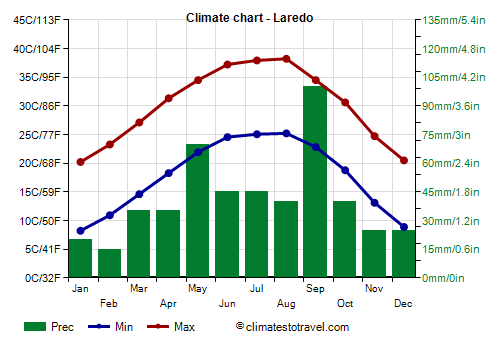
In the summer, the warmest area in all of Texas is the southwestern lowland area (see
Laredo), where highs from June to August are of 37/38 °C (99/100 °F). In this area, it can get hot all year round, and sometimes the temperature can exceed 30 °C (86 °F) even in winter.
Laredo - Average temperatures (1991-2020) |
| Month | Min | Max | Mean |
|---|
| January | 8.2 | 20.2 | 14.2 |
|---|
| February | 10.9 | 23.3 | 17.1 |
|---|
| March | 14.6 | 27.1 | 20.9 |
|---|
| April | 18.3 | 31.3 | 24.8 |
|---|
| May | 21.9 | 34.5 | 28.2 |
|---|
| June | 24.6 | 37.2 | 30.9 |
|---|
| July | 25.1 | 37.9 | 31.5 |
|---|
| August | 25.2 | 38.2 | 31.7 |
|---|
| September | 22.8 | 34.5 | 28.7 |
|---|
| October | 18.8 | 30.6 | 24.7 |
|---|
| November | 13.1 | 24.7 | 18.9 |
|---|
| December | 8.9 | 20.5 | 14.7 |
|---|
| Year | 17.7 | 30 | 23.85 |
|---|
Here too, however, short cold spells in winter cannot be excluded, with snowfalls and sub-freezing temperatures.
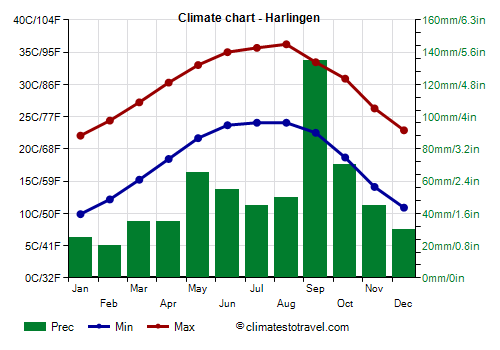
In winter, the mildest area of Texas is the southwestern tip, the so-called
Rio Grande Valley, (see
McAllen,
Harlingen, Brownsville), where the maximum temperatures exceed 20 °C (68 °F) even in December and January.
Here are the average temperatures in Harlingen.
Harlingen - Average temperatures (1991-2020) |
| Month | Min | Max | Mean |
|---|
| January | 9.9 | 22.1 | 16 |
|---|
| February | 12.2 | 24.4 | 18.3 |
|---|
| March | 15.2 | 27.2 | 21.2 |
|---|
| April | 18.4 | 30.3 | 24.4 |
|---|
| May | 21.7 | 33 | 27.3 |
|---|
| June | 23.7 | 35 | 29.3 |
|---|
| July | 24.1 | 35.7 | 29.9 |
|---|
| August | 24.1 | 36.2 | 30.1 |
|---|
| September | 22.5 | 33.4 | 28 |
|---|
| October | 18.7 | 30.9 | 24.8 |
|---|
| November | 14.1 | 26.3 | 20.2 |
|---|
| December | 10.9 | 22.9 | 16.9 |
|---|
| Year | 18 | 29.8 | 23.85 |
|---|
On the coast (see Port Isabel,
South Padre Island), the climate is milder, so the temperature rarely drops below freezing in winter, while it rarely exceeds 38 °C (100 °F) in summer.
The
sea in Texas is a bit cold in winter, around 17.5/18 °C (63.5/64.5 °F) in January and February, while in summer it gets very warm, so much so that it reaches or exceeds 28 °C (82.5 °F) from June to September. Here is the sea temperature in Galveston.
Galveston - Sea temperature| Month |
|---|
| January | 18 |
|---|
| February | 17.5 |
|---|
| March | 18.5 |
|---|
| April | 21 |
|---|
| May | 24.5 |
|---|
| June | 28 |
|---|
| July | 29.5 |
|---|
| August | 29.5 |
|---|
| September | 29 |
|---|
| October | 26 |
|---|
| November | 22.5"> |
|---|
| December | 20 |
|---|
| Year | 23.7 |
|---|
Tornados and hurricanes
In the center and north of Texas, in spring and early summer, generally from April to June, and more rarely in the fall,
tornadoes may develop, due to the collision of air masses.
Texas is also exposed to the risk of
hurricanes coming from the Gulf of Mexico. The areas most at risk are the coastal ones, because hurricanes weaken when they penetrate inland, however, they can still bring abundant rainfall. The hurricane season runs from June to November, although they are more likely from August to October, with a peak in September. Sometimes, the remnants of a hurricane can also arrive from the Pacific, though weakened, but they can still bring abundant rains.
When to go
To visit Texas you can choose
spring and autumn, to avoid both the winter cold, which can affect above all the north-west and the mountainous areas, but sometimes also the rest of the state, and the summer heat. However, it should be remembered that especially in the spring, tornadoes can form in the center-north, while in the autumn, there is the risk of hurricanes especially along the coast.
In winter, in the plains there are long mild periods, and in the south it is often a pleasant period, maybe the best of the year, but some very cold days cannot be excluded.
See also the
temperatures by month.