![]() Climate chart - Corpus Christi (Texas)
Climate chart - Corpus Christi (Texas)
The climate of Corpus Christi is
subtropical, with very mild winters and very hot, muggy and relatively rainy summers.
The city is located on the west coast of Texas (the one where the rains are less abundant), at the mouth of the Nueces River, which widens into a bay. Between the bay and the Gulf of Mexico lies a barrier island, Mustang Island.
The
winter, from December to February, is mild.
The sun shines quite often, although there are periods characterized by clouds, rain and wind.
Even in the middle of winter, there can be hot days, with highs around 25 °C (77 °F) and more, sometimes as high as 30 °C (86 °F).
However, there may also be cold periods, with highs below 10 °C (14 °F). Very rarely, as happened on Christmas 2004 and in December 2017, it can even snow. From 1981 to 2020, the record was -10.5 °C (13 °F), recorded in December 1989. In February 2021, the temperature dropped to -8 °C (17.5 °F).
The
summer, from June to September, is very hot and muggy. Due to high humidity the heat is sweltering, even though the breeze blows from the sea.
The sun often shines, but the sky is not always clear, as cloud coverings can form, which can give rise to thunderstorms.
On the hottest days of the year, the temperature typically reaches 38 °C (100 °F). The record is 43 °C (109.5 °F), recorded in early September 2000.
From June to November (but with a higher probability from August to October), there is the risk of
hurricanes. Being a coastal city, Corpus Christi is particularly exposed. The city was hit hard by Hurricane Celia in August 1970.
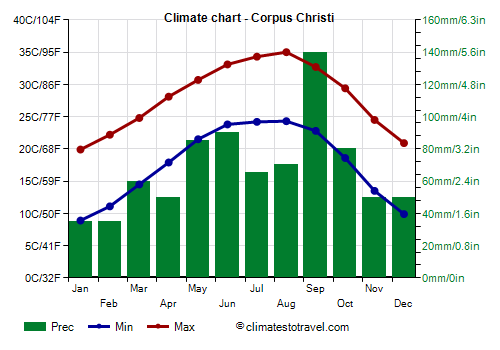
The
average temperature of the coldest month (January) is of 14.4 °C (57.9 °F), that of the warmest month (August) is of 29.6 °C (85.4 °F). Here are the average temperatures.
Corpus Christi - Average temperatures (1991-2020) | Month | Min (°C) | Max (°C) | Mean (°C) | Min (°F) | Max (°F) | Mean (°F) |
|---|
| January | 8.9 | 19.9 | 14.4 | 48 | 68 | 57.9 |
|---|
| February | 11.1 | 22.2 | 16.6 | 52 | 72 | 62 |
|---|
| March | 14.5 | 24.8 | 19.6 | 58 | 77 | 67.4 |
|---|
| April | 17.9 | 28.1 | 23 | 64 | 83 | 73.4 |
|---|
| May | 21.5 | 30.7 | 26.1 | 71 | 87 | 79 |
|---|
| June | 23.8 | 33.1 | 28.4 | 75 | 92 | 83.2 |
|---|
| July | 24.2 | 34.3 | 29.2 | 76 | 94 | 84.6 |
|---|
| August | 24.3 | 35 | 29.6 | 76 | 95 | 85.4 |
|---|
| September | 22.8 | 32.7 | 27.8 | 73 | 91 | 82 |
|---|
| October | 18.6 | 29.4 | 24 | 65 | 85 | 75.2 |
|---|
| November | 13.5 | 24.5 | 19 | 56 | 76 | 66.2 |
|---|
| December | 9.9 | 20.9 | 15.4 | 50 | 70 | 59.7 |
|---|
| Year | 17.6 | 28 | 22.75 | 63.7 | 82.4 | 73 |
|---|
amounts to 810 millimeters (31.9 inches) per year: so, it is at an intermediate level. It ranges from 35 mm (1.4 in) in the driest months (January and February) to 140 mm (5.5 in) in the wettest (September). Here is the average precipitation.
Corpus Christi - Average precipitation| Month | Millimeters | Inches | Days |
|---|
| January | 35 | 1.4 | 7 |
|---|
| February | 35 | 1.4 | 6 |
|---|
| March | 60 | 2.4 | 5 |
|---|
| April | 50 | 2 | 5 |
|---|
| May | 85 | 3.3 | 6 |
|---|
| June | 90 | 3.5 | 7 |
|---|
| July | 65 | 2.6 | 6 |
|---|
| August | 70 | 2.8 | 6 |
|---|
| September | 140 | 5.5 | 9 |
|---|
| October | 80 | 3.1 | 6 |
|---|
| November | 50 | 2 | 6 |
|---|
| December | 50 | 2 | 6 |
|---|
| Year | 810 | 31.9 | 77 |
|---|
On average, there are around 2,635
sunshine hours per year. Here are the average sunshine hours per day.
Corpus Christi - Sunshine hours| Month | Average | Total |
|---|
January | 4.5 | 140 | February | 5.5 | 155 | March | 6.5 | 200 | April | 7 | 210 | May | 7.5 | 235 | June | 9.5 | 290 | July | 10.5 | 330 | August | 9.5 | 300 | September | 8 | 245 | October | 7.5 | 230 | November | 5.5 | 170 | December | 4.5 | 135 | Year | 7.2 | 2640 |
The
sea temperature ranges between 19 °C (66 °F) and 29 °C (84 °F). From January to March, the sea is a bit cold, while it becomes pleasantly warm for swimming from June to October. Here are the average sea temperatures.
Corpus Christi - Sea temperature| Month | Celsius (°C) | Fahrenheit (°F) |
|---|
January | 20 | 68 | February | 19 | 66 | March | 19.5 | 67 | April | 21.5 | 71 | May | 25 | 77 | June | 28 | 82 | July | 28.5 | 83 | August | 29 | 84 | September | 28.5 | 84 | October | 27 | 80 | November | 24 | 75 | December | 21.5 | 71 | Year | 24.3 | 75.7 |

Best Time
The best time to visit Corpus Christi is from November to March. Winter, from December to February, is generally a mild season, although it can sometimes get cold (especially in December and January). You can therefore choose the months of March and November.
Return to the climate of
Texas.
Corpus Christi - Weather by month
Based on the period 1991-2020
January, the coldest month of the year, is generally a mild month. The average temperature is of 14.4 °C (58 °F), with a minimum of 8.9 °C (48 °F) and a maximum of 19.9 °C (67.8 °F).

On the coldest nights of the month, the temperature usually drops to around -0.5 °C (31.5 °F). However, it dropped to -5.6 °C (21.9 °F) in January 1996.

On the warmest days of the month, the temperature usually reaches around 28.5 °C (83.5 °F). However, it reached 33.3 °C (91.9 °F) in January 2017.

Precipitation amounts to 35 mm (1.4 in), distributed over 7 days.
The day lasts on average 10 hours and 35 minutes.

There are on average 4.5 hours of sunshine per day. So, the sun shines 43% of the time.
The average humidity is 73%. Hence, the air is normally humid.
The average wind speed is 19 kph (12 mph).

The average sea temperature is of 20 °C (68 °F). Therefore, the sea is very cool for swimming.
February is generally a very mild month. The average temperature is of 16.6 °C (62 °F), with a minimum of 11.1 °C (52 °F) and a maximum of 22.2 °C (72 °F).
On the coldest nights of the month, the temperature usually drops to around 1 °C (34 °F). However, it dropped to -5 °C (23 °F) in February 1994.
On the warmest days of the month, the temperature usually reaches around 30.5 °C (87 °F). However, it reached 35 °C (95 °F) in February 2006.
Precipitation amounts to 35 mm (1.4 in), distributed over 6 days.
The day lasts on average 11 hours and 10 minutes.
There are on average 5.5 hours of sunshine per day. So, the sun shines 50% of the time.
The average humidity is 74%. Hence, the air is normally humid.
The average wind speed is 20 kph (13 mph).
The average sea temperature is of 19 °C (66 °F). Therefore, the sea is very cool for swimming.
March is generally a warm month. The average temperature is of 19.6 °C (67 °F), with a minimum of 14.5 °C (58.1 °F) and a maximum of 24.8 °C (76.6 °F).
On the coldest nights, which normally occur at the beginning of the month, the temperature usually drops to around 4 °C (39.5 °F). However, it dropped to -2.2 °C (28 °F) in March 2002.
On the warmest days, which normally occur at the end of the month, the temperature usually reaches around 32 °C (90 °F). However, it reached 37.2 °C (99 °F) in March 1991.
Precipitation amounts to 60 mm (2.4 in), distributed over 5 days.
The day lasts on average 12 hours and 0 minutes.
There are on average 6.5 hours of sunshine per day. So, the sun shines 53% of the time.
The average humidity is 73%. Hence, the air is normally humid.
The average wind speed is 22 kph (13 mph).
The average sea temperature is of 19.5 °C (67 °F). Therefore, the sea is very cool for swimming.
April is generally a warm to hot, muggy month. The average temperature is of 23 °C (73 °F), with a minimum of 17.9 °C (64.2 °F) and a maximum of 28.1 °C (82.6 °F).
On the coldest nights, which normally occur at the beginning of the month, the temperature usually drops to around 8.5 °C (47.5 °F). However, it dropped to 4 °C (39.2 °F) in April 2007.
On the warmest days, which normally occur at the end of the month, the temperature usually reaches around 34 °C (93.5 °F). However, it reached 39.4 °C (102.9 °F) in April 2014.
Precipitation amounts to 50 mm (2 in), distributed over 5 days.
The day lasts on average 12 hours and 55 minutes.
There are on average 7 hours of sunshine per day. So, the sun shines 54% of the time.
The average humidity is 73%. Hence, the air is normally humid.
The average wind speed is 22 kph (14 mph).
The average sea temperature is of 21.5 °C (71 °F). Therefore, the sea is cool for swimming.
May is generally a warm to hot, muggy month. The average temperature is of 26.1 °C (79 °F), with a minimum of 21.5 °C (70.7 °F) and a maximum of 30.7 °C (87.3 °F).
On the coldest nights, which normally occur at the beginning of the month, the temperature usually drops to around 13.5 °C (56.5 °F). However, it dropped to 9.4 °C (48.9 °F) in May 2013.
On the warmest days, which normally occur at the end of the month, the temperature usually reaches around 34.5 °C (94 °F). However, it reached 38 °C (100.4 °F) in May 1999.
Precipitation amounts to 85 mm (3.3 in), distributed over 6 days.
The day lasts on average 13 hours and 35 minutes.
There are on average 7.5 hours of sunshine per day. So, the sun shines 56% of the time.
The average humidity is 76%. Hence, the air is normally humid.
The average wind speed is 21 kph (13 mph).
The average sea temperature is of 25 °C (77 °F). Therefore, the sea is warm enough for swimming.
June is generally a very hot, muggy month. The average temperature is of 28.4 °C (83 °F), with a minimum of 23.8 °C (74.8 °F) and a maximum of 33.1 °C (91.6 °F).
On the coldest nights, the temperature usually drops to around 20 °C (68 °F). However, it dropped to 16.7 °C (62.1 °F) in June 1997.
On the warmest days, the temperature usually reaches around 36 °C (97 °F). However, it reached 41.7 °C (107.1 °F) in June 2013.
Precipitation amounts to 90 mm (3.5 in), distributed over 7 days.
The day lasts on average 13 hours and 55 minutes. June 21, the summer solstice, is the longest day of the year in the Northern Hemisphere.
There are on average 9.5 hours of sunshine per day. So, the sun shines 70% of the time.
The average humidity is 76%. Hence, the air is normally humid.
The average wind speed is 17 kph (11 mph).
The average sea temperature is of 28 °C (82 °F). Therefore, the sea is pleasantly warm and allows long swims.
July is generally a very hot, muggy month. The average temperature is of 29.2 °C (85 °F), with a minimum of 24.2 °C (75.6 °F) and a maximum of 34.3 °C (93.7 °F).
On the coldest nights of the month, the temperature usually drops to around 21.5 °C (70.5 °F). However, it dropped to 20 °C (68 °F) in July 1997.
On the warmest days of the month, the temperature usually reaches around 36.5 °C (98 °F). However, it reached 39.4 °C (102.9 °F) in July 2000.
Precipitation amounts to 65 mm (2.6 in), distributed over 6 days.
The day lasts on average 13 hours and 40 minutes.
There are on average 10.5 hours of sunshine per day. So, the sun shines 77% of the time.
The average humidity is 75%. Hence, the air is normally humid.
The average wind speed is 17 kph (11 mph).
The average sea temperature is of 28.5 °C (83.5 °F). Therefore, the sea is pleasantly warm and allows long swims.
August, the hottest month of the year, is generally a very hot, muggy month. The average temperature is of 29.6 °C (85 °F), with a minimum of 24.3 °C (75.7 °F) and a maximum of 35 °C (95 °F).
On the coldest nights of the month, the temperature usually drops to around 21.5 °C (71 °F). However, it dropped to 17.8 °C (64 °F) in August 2004.
On the warmest days of the month, the temperature usually reaches around 38 °C (100 °F). However, it reached 41.7 °C (107.1 °F) in August 2011.
Precipitation amounts to 70 mm (2.8 in), distributed over 6 days.
The day lasts on average 13 hours and 5 minutes.
There are on average 9.5 hours of sunshine per day. So, the sun shines 74% of the time.
The average humidity is 72%. Hence, the air is normally humid.
The average wind speed is 16 kph (10 mph).
The average sea temperature is of 29 °C (84 °F). Therefore, the sea is pleasantly warm and allows long swims.
September is generally a very hot, muggy month. The average temperature is of 27.8 °C (82 °F), with a minimum of 22.8 °C (73 °F) and a maximum of 32.7 °C (90.9 °F).
On the coldest nights, the temperature usually drops to around 17 °C (62.5 °F). However, it dropped to 10.6 °C (51.1 °F) in September 2020.
On the warmest days, the temperature usually reaches around 36.5 °C (97.5 °F). However, it reached 42.8 °C (109 °F) in September 2000.
Precipitation amounts to 140 mm (5.5 in), distributed over 9 days.
The day lasts on average 12 hours and 20 minutes.
There are on average 8 hours of sunshine per day. So, the sun shines 66% of the time.
The average humidity is 74%. Hence, the air is normally humid.
The average wind speed is 15 kph (9 mph).
The average sea temperature is of 28.5 °C (83.5 °F). Therefore, the sea is pleasantly warm and allows long swims.
October is generally a warm to hot, muggy month. The average temperature is of 24 °C (75 °F), with a minimum of 18.6 °C (65.5 °F) and a maximum of 29.4 °C (84.9 °F).
On the coldest nights, which normally occur at the end of the month, the temperature usually drops to around 8 °C (46.5 °F). However, it dropped to -2.2 °C (28 °F) in October 1993.
On the warmest days, which normally occur at the beginning of the month, the temperature usually reaches around 34.5 °C (94 °F). However, it reached 38.9 °C (102 °F) in October 2010.
Precipitation amounts to 80 mm (3.1 in), distributed over 6 days.
The day lasts on average 11 hours and 30 minutes.
There are on average 7.5 hours of sunshine per day. So, the sun shines 65% of the time.
The average humidity is 73%. Hence, the air is normally humid.
The average wind speed is 17 kph (10 mph).
The average sea temperature is of 27 °C (80 °F). Therefore, the sea is pleasantly warm and allows long swims.
November is generally a warm month. The average temperature is of 19 °C (66 °F), with a minimum of 13.5 °C (56.3 °F) and a maximum of 24.5 °C (76.1 °F).
On the coldest nights, which normally occur at the end of the month, the temperature usually drops to around 3 °C (38 °F). However, it dropped to -2.8 °C (27 °F) in November 2011.
On the warmest days, which normally occur at the beginning of the month, the temperature usually reaches around 31.5 °C (88.5 °F). However, it reached 33.9 °C (93 °F) in November 1994.
Precipitation amounts to 50 mm (2 in), distributed over 6 days.
The day lasts on average 10 hours and 50 minutes.
There are on average 5.5 hours of sunshine per day. So, the sun shines 52% of the time.
The average humidity is 73%. Hence, the air is normally humid.
The average wind speed is 18 kph (11 mph).
The average sea temperature is of 24 °C (75 °F). Therefore, the sea is warm enough for swimming.
December is generally a very mild month. The average temperature is of 15.4 °C (60 °F), with a minimum of 9.9 °C (49.8 °F) and a maximum of 20.9 °C (69.6 °F).
On the coldest nights of the month, the temperature usually drops to around 0 °C (32 °F). However, it dropped to -6 °C (21.2 °F) in December 1996.
On the warmest days of the month, the temperature usually reaches around 29 °C (84.5 °F). However, it reached 32.8 °C (91 °F) in December 2019.
Precipitation amounts to 50 mm (2 in), distributed over 6 days.
The day lasts on average 10 hours and 25 minutes. December 21, the winter solstice, is the shortest day of the year in the Northern Hemisphere.
There are on average 4.5 hours of sunshine per day. So, the sun shines 42% of the time.
The average humidity is 73%. Hence, the air is normally humid.
The average wind speed is 18 kph (11 mph).
The average sea temperature is of 21.5 °C (70.5 °F). Therefore, the sea is cool for swimming.