Select units of measurement for the temperature and rainfall tables (metric or imperial).
Average weather, temperature, rainfall, sunshine
Saudi Arabia is an Asian country that occupies most of the Arabian Peninsula and is crossed by the Tropic of Cancer. To the west it overlooks the Red Sea and to the east the Persian Gulf. To the west there is a mountain range parallel to the coast, while the interior is largely occupied by a plateau. Only in the south-east is a flat area.
In Saudi Arabia, there is almost everywhere a
desert climate, with an extremely hot summer, which goes from May to September. However, on the plateau it can get cold in winter, especially at night and in the north.
In Saudi Arabia, good weather often prevails even in winter, however, in this season, the country is sometimes affected by
frontal systems coming from the Mediterranean, especially in the center-north, where, every now and then, even a bit of cold air can arrive. Instead, in summer the southern part is marginally affected by the
humid circulation which affects nearby Yemen and the Arabian Sea, so much so that in the south-west there is a mountainous area that receives some rain, especially in July and August.
The
rains in Saudi Arabia are very scarce, usually from 50 to 150 millimeters (2 to 6 inches) per year, and are almost everywhere concentrated from November to April, except in the mountains of the south-west, where it can exceed 250 mm (10 in), and as we have said it can rain even in summer.
In Saudi Arabia, there are practically no
rivers of any importance, but as happens in desert countries, there are many dry riverbeds, called
wadis, which can sometimes turn into ephemeral streams after the rains, which although rare, can sometimes be violent.
In the
Köppen classification, the climate of Saudi Arabia is almost everywhere hot desert (BWh), although the far north approaches the cold desert climate (BWk), while the mountains of the south-west fall into the cold semi-arid climate, or steppe (BSk).
Index
- The coasts - West Coast, Al Wajh, Jeddah, Mecca, Jizan, East Coast, Dammam
- The plateau - Syrian desert, Turaif, Najd, Ha'il, Riyadh, Medina, Rub' al Khali
- The mountains - Abha
- When to go
- What to pack
- Climate data
The coasts
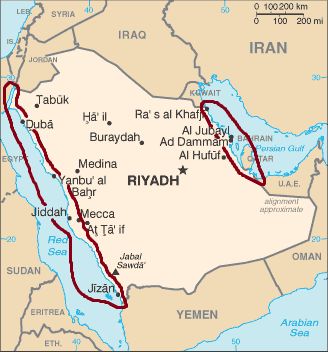
Along both the western and eastern coasts of Saudi Arabia, the climate is desert, and it's particularly mild in winter, even warm in the central and southern part of the Red Sea coast, while in summer, it's very hot everywhere, but it's sultry on the shores of the Red Sea, especially in the southern part (see Jizan), and a bit drier, and therefore more torrid, on the shores of the Persian Gulf.
Red Sea Coast
In the thin coastal region overlooking the Red Sea, called
Tihamah, winter is mild in the northern part and hot in the central-southern part, while summer is very hot everywhere.
The rare rains occur from November to April in the central-northern part, while in the southernmost part (see Jizan), some rain also occurs in summer.
Sometimes, the rains can be intense and concentrated in time, to the point that they can cause
flash floods.
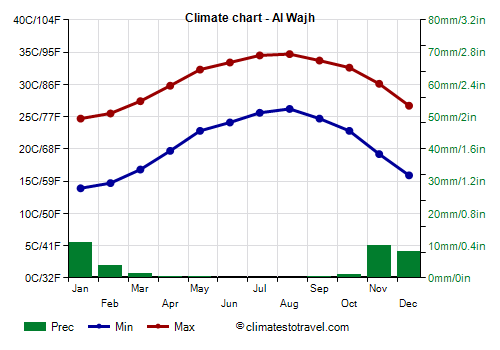
In the northern part, winter is mild, in fact, the average in January ranges from 15 °C (59 °F) on the Gulf of Aqaba to 19.5 °C (67 °F) in
Al Wajh (or Wejh). In this area, it can sometimes get cold in winter. Summers are not as hot as in most of Saudi Arabia, but the humidity is much higher.
The Red Sea in Al Wajh is warm enough for swimming all year round, although it goes down to 23.5 °C (74 °F) in February and March, while it becomes very warm in summer.
In the northernmost part, in the Gulf of Aqaba, it is a bit cool in winter, since it goes down to 21 °C (70 °F) in February and March.

Already in the central part of the coast, winter is warm, so much so that in
Jeddah, the largest city on the Red Sea coast, the average in January is 23.5 °C (74.5 °F). Summer, on the other hand, is very hot.
Even hotter than Jeddah is
Mecca, which is not located right on the coast but further east, and is a
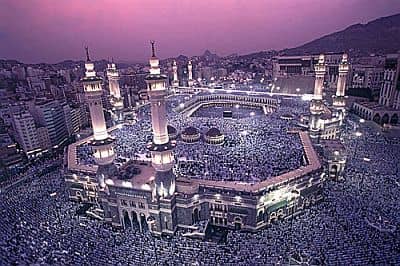
very hot city. At the worst times the temperature can reach 50 °C (122 °F).
In the southernmost part of the coast, we find
Jizan (or Gizan), which in winter is the hottest city in Saudi Arabia, while in summer it is decidedly muggy. Besides, it is possible that some rain may fall here even in this season, especially in August.
In Jizan, and on the Farasan Islands, which lie off the coast, the sea is warm all year round, and exceeds 30 °C (86 °F) from May to October.
Persian Gulf Coast
In the east, on the
coast of the Persian Gulf, the climate is sunny and desert. Winter is mild, but it's cooler than on the Red Sea coast: the average in January is between 12 and 17 °C (54 and 63 °F). Sometimes at night it can get cold, especially in the northern part, near the border with Kuwait, where lows can drop to around freezing (0 °C or 32 °F).
Summer is very hot and sunny. However, since the prevailing wind blows from the northwest, originally from the Iraqi desert, and therefore it does not come directly from the sea, the summer is a bit less humid than on the coast of the Red Sea.
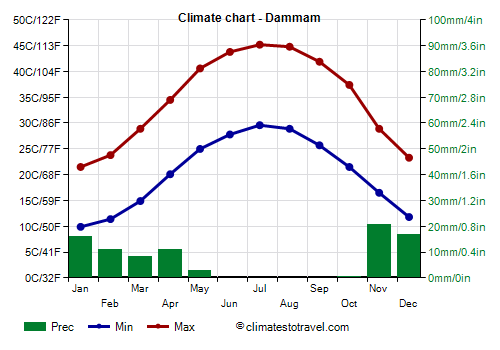
In the central part of the coast, we find
Dammam, and the nearby cities of Dhahran and Khobar.
The Persian Gulf, in the central part, is a bit cool from January to March, while it becomes very warm from May to November. In summer, the Persian Gulf becomes the warmest sea in the world, even more so than the Red Sea.
In the northernmost part, near the border with Kuwait, the sea in winter is a bit colder, in fact, the temperature drops to 18 °C (64 °F) in February and March. In contrast, in the southernmost part, in the small coastal stretch between Qatar and the Emirates, the sea in winter is a bit warmer, so much so that the water temperature does not go below 23 °C (73 °F).
The plateau
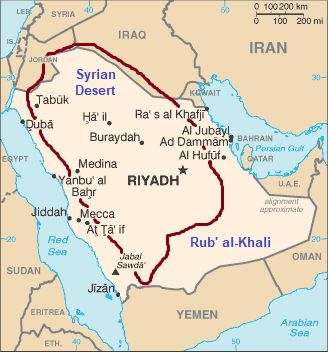
As mentioned, most of the Arabian Peninsula is occupied by a
plateau, whose altitude goes between 400 and 1,200 meters (1,300 and 4,000 feet). In addition to the rocky deserts, there is a series of sandy deserts, interrupted by rare oases, and connected to one another, called
An Nafud,
ad-Dahna, and
Rub 'al Khali. The latter is the largest, a huge expanse of sand that occupies the south of the country, and is located largely outside the plateau, at a lowland altitude.
The plateau,
desert and sunny like almost all of Saudi Arabia, has a fairly uniform climate: mild in winter, but with very cool or cold nights, and very hot in summer, but with low humidity. The main differences occur in
winter, when the northern part is much colder than the southern one.
Syrian desert
In the far north, there is an offshoot of the
Syrian desert, which has a desert continental climate, with relatively cold winters, also due to the higher altitude, and hot summers.
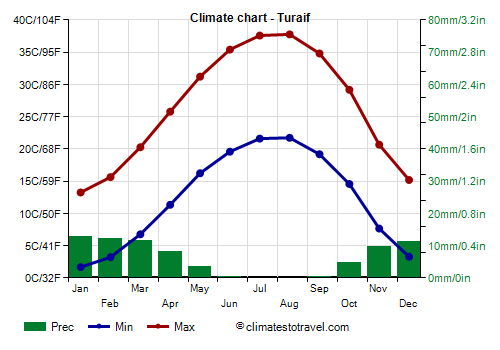
In this area we find the city of
Turaif, which in winter is the coldest in Saudi Arabia. During winter, cold waves can occur: in these cases, the temperature can drop to -6/-8 °C (17/21 °F), and more rarely (given the low precipitation amount) it can even snow. On the contrary, despite the altitude, the temperature in summer can reach 43/45 °C (109/113 °F).
Precipitation occurs from November to April and is scarce, while from June to September, basically, it never rains.
Najd
To the south of the Syrian desert we find the historical plateau of Arabia, called
Najd (also spelled Nejd, Neged or Nujd). Although it is milder than the Syrian Desert, in winter, especially in the central-northern part, it can sometimes get cold. In
Ha'il, at 1,000 meters (3,300 ft) above sea level, the record is even -10 °C (14 °F). In the long summer, from May to September, the temperature can exceed 45 °C (113 °F).
Rainfall, typically lower than 100 mm (4 in) per year, occurs almost all from the end of October to the beginning of May, and is irregular from year to year. Furthermore, given that the rains can sometimes be intense and concentrated in time, even in this area, flash floods can occasionally occur.
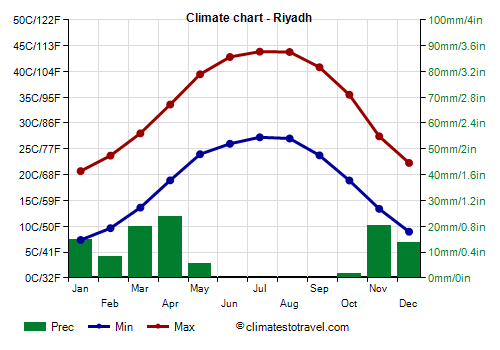
In the central part of the plateau we find
Riyadh, the capital, where it can sometimes get cold on winter nights.
Instead, further west we find
Medina (
Al-Madinah al-Munawwarah, "The Enlightened City"), which is milder.
Rub' al Khali
In the south, the desert of
Rub 'al Khali, uninhabited and mysterious, is quite warm even in winter, with highs in January around 25/26 °C (77/79 °F). At night, it can get pretty cool, but temperatures do not drop below freezing. As mentioned, the central-eastern part of the desert is outside the plateau, in fact the altitude ranges from 70 to 300 meters (230 to 1,000 ft), while in the western part it reaches up to 800 meters (2,600 ft).
In summer, the southernmost part of this desert is brushed by the south-west monsoon, which brings currents from the Arabian Sea towards India, in fact, some cloud banks may pass over the area, and sometimes, even a rain shower may occur.

Very rarely, the Rub 'al Khali desert may be affected by the remains of
tropical cyclones coming from the Arabian Sea, which can bring sand storms, and unusual rains in the middle of the desert, as happened in May 2018 with Cyclone Mekunu. Cyclones form from May to December, and are more frequent at the beginning of the period (May-June) and a little less at the end (October-December).
The mountains

The western part of Saudi Arabia, known as
Hejaz, is crossed by a mountain range parallel to the coast of the Red Sea. In the north (the area circled in green on the map), the climate is desert, with no summer rainfall, though some rains are possible in winter, and even snowfalls at the highest altitudes, as happens in
Jebel al Lawz, 2,580 meters (8,465 feet) high, located in the north-west.
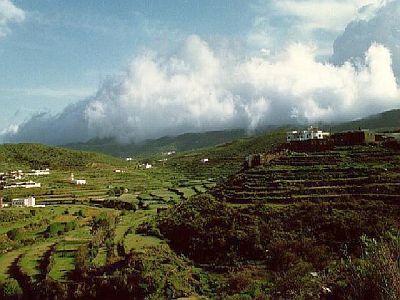
In the southern part of the mountains, in the Asir, Jizan and Al-Bahah regions (burgundy area), there are several peaks above 2,000 meters (6,500 feet), among which is the highest mountain of Saudi Arabia,
Jabal Sawda, 2,990 meters (9,810 feet) high.
In this area, the climate is obviously tempered by altitude, in addition, in summer, especially in the southern part,
rains and thunderstorms may occur.
Some rain may fall also in spring, between March and May. In some areas, precipitation exceeds 250 mm (10 in) per year, so the climate is semi-arid rather than desert. On the southwest-facing slopes, there are verdant landscapes and terraces, where water springs are used for irrigation.
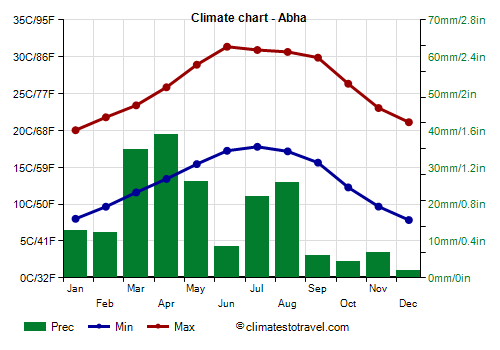
In July and August,
Abha, located near the Asir National Park, at 2,000 meters (6,500 feet) above sea level, is the mildest city in Saudi Arabia, with highs around 30 °C (86 °F).
When to go
In much of Saudi Arabia, either in the areas where the winter is mild (ie the northern part of the Red Sea coast, the central plateau, where Riyadh and Medina are located, and the coast of the Persian Gulf) or where the winter is warmer (ie Mecca, Jeddah, the south-central part of the Red Sea Coast and the Rub 'al Khali), the best time is
from December to February, since in this way you can avoid the heat, which can be intense in the rest of the year (but especially in summer).
However, in the northern areas, north of Riyadh (see Ha'il, Rafha, Tabuk) you can avoid the winter, which can be cold, and choose the months of
March and November. In the far north, in the Syrian desert (see Turayf, Al Qurayyat) where the winter is longer, you can choose April and October.
In
summer, in July and August, the only areas where the heat is bearable are the mountains, in particular, in Abha and Asir, where however, rain and thunderstorms can occur.
For
swimming and sunbathing, the best month in the Persian Gulf is November (in March the sea is still a bit cool, while in April it starts to get hot). In the central-northern part of the Red Sea you can go in March and November, while in the central-southern part, from Jeddah down to the border with Yemen, you can go from November to March, because in those parts both the sea and the weather are warm even in winter.
In summer, even though the sea is very warm, it's too hot for sunbathing.
What to pack
In
winter: in the Syrian desert, bring warm clothes, such as a down jacket, a hat, a raincoat or umbrella, and a scarf.
In the Persian Gulf coast, bring spring/autumn clothes, a T-shirt for warm days, a sweater and a jacket for the central and southern parts (see Dammam, Al Khobar), a heavier jacket and a hat for the northern part (see Khafji), a scarf for the wind, and possibly an umbrella.
For the Red Sea coast, north of Jeddah, light clothes for the day, a sweater and a light jacket for the evening, which sometimes can also be used in Jeddah and Mecca. In the southern part (see Jizan), in addition to light clothes, you just need a scarf for the breeze and possibly a light sweatshirt for the evening.
For the plateau, Riyadh and Medina, spring/autumn clothes, a warm jacket and a hat for the evening, especially in the north. For the Rub 'al Khali, light clothes for the day, a scarf or turban, desert boots or sandals, and a sweater or jacket for the evening and early morning.
For the western mountains, in the north, warm clothes, such as a down jacket and sweater; in the south, spring/autumn clothes (light for the day), a sun hat, a sweater and a jacket for the evening.
In
summer: for the Syrian desert and the plateau above 700 meters (2,300 feet, see Ha'il), bring light clothes, a sun hat, a sweatshirt or sweater for outdoor evenings, and a scarf.
For Mecca, the plateau and Riyadh, the Rub 'al Khali and the coasts of the Persian Gulf and the Red Sea, lightweight clothes, long and made of natural fabric (cotton or linen), a desert turban; a sweatshirt and a scarf for air conditioned places.
For the western mountains, light clothes for the day, a sun hat or desert turban, a sweatshirt or sweater for the evening, hiking shoes; for the southern part, you can add a raincoat or umbrella.
Women should cover their entire body except for their face and hands.
Climate data - Saudi Arabia
| Abha (2,000 meters) |
|---|
|
| Jan | Feb | Mar | Apr | May | Jun | Jul | Aug | Sep | Oct | Nov | Dec |
|---|
| Min temp. | 8 | 10 | 12 | 13 | 15 | 17 | 18 | 17 | 16 | 12 | 10 | 8 |
|---|
| Max temp. | 20 | 22 | 23 | 26 | 29 | 31 | 31 | 31 | 30 | 26 | 23 | 21 |
|---|
| Precip. | 15 | 10 | 35 | 40 | 25 | 10 | 20 | 25 | 5 | 5 | 5 | 0 |
|---|
| Prec. days | 4 | 4 | 7 | 10 | 8 | 4 | 7 | 11 | 2 | 2 | 2 | 3 |
|---|
| Humidity | 67% | 61% | 58% | 55% | 46% | 33% | 42% | 48% | 33% | 38% | 58% | 64% |
|---|
| Day length | 11 | 12 | 12 | 13 | 13 | 13 | 13 | 13 | 12 | 12 | 11 | 11 |
|---|
| Sun hours | 9 | 9 | 10 | 9 | 9 | 9 | 8 | 8 | 9 | 9 | 9 | 9 |
|---|
|
| Al Wajh |
|---|
|
| Jan | Feb | Mar | Apr | May | Jun | Jul | Aug | Sep | Oct | Nov | Dec |
|---|
| Min temp. | 14 | 15 | 17 | 20 | 23 | 24 | 26 | 26 | 25 | 23 | 19 | 16 |
|---|
| Max temp. | 25 | 26 | 27 | 30 | 32 | 33 | 34 | 35 | 34 | 33 | 30 | 27 |
|---|
| Precip. | 10 | 5 | 0 | 0 | 0 | 0 | 0 | 0 | 0 | 0 | 10 | 10 |
|---|
| Prec. days | 2 | 1 | 0 | 0 | 0 | 0 | 0 | 0 | 0 | 0 | 0 | 1 |
|---|
| Humidity | 55% | 55% | 58% | 60% | 63% | 69% | 72% | 74% | 74% | 66% | 56% | 53% |
|---|
| Day length | 11 | 11 | 12 | 13 | 13 | 14 | 14 | 13 | 12 | 12 | 11 | 10 |
|---|
| Sun hours | 9 | 10 | 10 | 11 | 12 | 14 | 14 | 13 | 12 | 11 | 10 | 9 |
|---|
| Sea temp | 24 | 24 | 24 | 24 | 26 | 28 | 29 | 30 | 29 | 28 | 27 | 26 |
|---|
| Dammam |
|---|
|
| Jan | Feb | Mar | Apr | May | Jun | Jul | Aug | Sep | Oct | Nov | Dec |
|---|
| Min temp. | 10 | 11 | 15 | 20 | 25 | 28 | 30 | 29 | 26 | 22 | 16 | 12 |
|---|
| Max temp. | 22 | 24 | 29 | 34 | 41 | 44 | 45 | 45 | 42 | 37 | 29 | 23 |
|---|
| Precip. | 15 | 10 | 10 | 10 | 5 | 0 | 0 | 0 | 0 | 0 | 20 | 15 |
|---|
| Prec. days | 2 | 2 | 2 | 2 | 0 | 0 | 0 | 0 | 0 | 0 | 2 | 2 |
|---|
|
| Day length | 11 | 11 | 12 | 13 | 14 | 14 | 14 | 13 | 12 | 12 | 11 | 10 |
|---|
| Sun hours | 8 | 8 | 8 | 9 | 10 | 12 | 11 | 11 | 11 | 10 | 9 | 8 |
|---|
| Sea temp | 21 | 20 | 20 | 23 | 27 | 30 | 32 | 33 | 33 | 30 | 27 | 24 |
|---|
| Hail (1,000 meters) |
|---|
|
| Jan | Feb | Mar | Apr | May | Jun | Jul | Aug | Sep | Oct | Nov | Dec |
|---|
| Min temp. | 4 | 6 | 10 | 15 | 20 | 23 | 24 | 24 | 22 | 17 | 10 | 6 |
|---|
| Max temp. | 18 | 20 | 24 | 30 | 35 | 39 | 40 | 40 | 38 | 33 | 24 | 20 |
|---|
| Precip. | 10 | 5 | 15 | 10 | 5 | 0 | 0 | 0 | 0 | 5 | 15 | 5 |
|---|
| Prec. days | 2 | 1 | 2 | 2 | 1 | 0 | 0 | 0 | 0 | 2 | 3 | 1 |
|---|
| Humidity | 50% | 40% | 34% | 29% | 21% | 15% | 15% | 16% | 17% | 26% | 46% | 50% |
|---|
| Day length | 11 | 11 | 12 | 13 | 14 | 14 | 14 | 13 | 12 | 12 | 11 | 10 |
|---|
|
|
| Jeddah |
|---|
|
| Jan | Feb | Mar | Apr | May | Jun | Jul | Aug | Sep | Oct | Nov | Dec |
|---|
| Min temp. | 19 | 19 | 20 | 23 | 25 | 26 | 27 | 29 | 27 | 25 | 23 | 20 |
|---|
| Max temp. | 29 | 30 | 32 | 35 | 37 | 38 | 39 | 39 | 38 | 37 | 33 | 31 |
|---|
| Precip. | 10 | 5 | 0 | 0 | 0 | 0 | 0 | 0 | 0 | 0 | 25 | 10 |
|---|
| Prec. days | 2 | 1 | 1 | 1 | 0 | 0 | 0 | 1 | 0 | 1 | 2 | 2 |
|---|
| Humidity | 58% | 57% | 56% | 53% | 52% | 53% | 49% | 56% | 64% | 63% | 61% | 59% |
|---|
| Day length | 11 | 11 | 12 | 13 | 13 | 13 | 13 | 13 | 12 | 12 | 11 | 11 |
|---|
| Sun hours | 7 | 9 | 10 | 11 | 12 | 11 | 10 | 11 | 11 | 11 | 9 | 8 |
|---|
| Sea temp | 26 | 26 | 26 | 27 | 29 | 29 | 31 | 31 | 31 | 31 | 30 | 28 |
|---|
| Jizan |
|---|
|
| Jan | Feb | Mar | Apr | May | Jun | Jul | Aug | Sep | Oct | Nov | Dec |
|---|
| Min temp. | 22 | 23 | 24 | 27 | 28 | 30 | 30 | 30 | 29 | 27 | 25 | 23 |
|---|
| Max temp. | 31 | 31 | 33 | 35 | 38 | 38 | 38 | 38 | 38 | 36 | 34 | 32 |
|---|
| Precip. | 15 | 5 | 5 | 10 | 10 | 0 | 15 | 30 | 10 | 20 | 15 | 15 |
|---|
| Prec. days | 3 | 1 | 1 | 2 | 1 | 1 | 2 | 4 | 2 | 2 | 1 | 2 |
|---|
| Humidity | 72% | 72% | 69% | 65% | 62% | 62% | 59% | 64% | 66% | 66% | 68% | 72% |
|---|
| Day length | 11 | 12 | 12 | 12 | 13 | 13 | 13 | 13 | 12 | 12 | 11 | 11 |
|---|
| Sun hours | 8 | 8 | 9 | 10 | 11 | 9 | 7 | 8 | 9 | 10 | 9 | 8 |
|---|
| Sea temp | 27 | 26 | 27 | 28 | 30 | 32 | 32 | 32 | 32 | 32 | 30 | 28 |
|---|
| Mecca (240 meters) |
|---|
|
| Jan | Feb | Mar | Apr | May | Jun | Jul | Aug | Sep | Oct | Nov | Dec |
|---|
| Min temp. | 19 | 20 | 22 | 25 | 28 | 29 | 30 | 30 | 29 | 26 | 23 | 21 |
|---|
| Max temp. | 31 | 33 | 35 | 39 | 42 | 44 | 43 | 43 | 43 | 40 | 36 | 33 |
|---|
| Precip. | 20 | 0 | 5 | 10 | 5 | 0 | 0 | 5 | 5 | 15 | 25 | 15 |
|---|
| Prec. days | 4 | 1 | 2 | 2 | 1 | 0 | 0 | 1 | 2 | 2 | 4 | 3 |
|---|
| Humidity | 56% | 52% | 46% | 40% | 34% | 30% | 32% | 39% | 42% | 48% | 55% | 57% |
|---|
| Day length | 11 | 11 | 12 | 13 | 13 | 13 | 13 | 13 | 12 | 12 | 11 | 11 |
|---|
| Sun hours | 8 | 9 | 9 | 9 | 10 | 11 | 10 | 10 | 9 | 10 | 9 | 8 |
|---|
|
| Medina (600 meters) |
|---|
|
| Jan | Feb | Mar | Apr | May | Jun | Jul | Aug | Sep | Oct | Nov | Dec |
|---|
| Min temp. | 12 | 14 | 17 | 22 | 26 | 29 | 30 | 31 | 29 | 23 | 18 | 14 |
|---|
| Max temp. | 24 | 27 | 31 | 36 | 40 | 43 | 43 | 44 | 42 | 37 | 31 | 26 |
|---|
| Precip. | 10 | 5 | 5 | 5 | 5 | 0 | 0 | 5 | 0 | 5 | 15 | 5 |
|---|
| Prec. days | 3 | 1 | 3 | 4 | 3 | 0 | 0 | 2 | 1 | 2 | 3 | 3 |
|---|
| Humidity | 35% | 28% | 21% | 19% | 15% | 10% | 12% | 14% | 12% | 17% | 31% | 36% |
|---|
| Day length | 11 | 11 | 12 | 13 | 13 | 14 | 14 | 13 | 12 | 12 | 11 | 11 |
|---|
| Sun hours | 8 | 9 | 10 | 11 | 12 | 13 | 12 | 12 | 12 | 11 | 9 | 8 |
|---|
|
| Riyadh (600 meters) |
|---|
|
| Jan | Feb | Mar | Apr | May | Jun | Jul | Aug | Sep | Oct | Nov | Dec |
|---|
| Min temp. | 7 | 10 | 14 | 19 | 24 | 26 | 27 | 27 | 24 | 19 | 13 | 9 |
|---|
| Max temp. | 21 | 24 | 28 | 34 | 39 | 43 | 44 | 44 | 41 | 36 | 27 | 22 |
|---|
| Precip. | 15 | 10 | 20 | 25 | 5 | 0 | 0 | 0 | 0 | 0 | 20 | 15 |
|---|
| Prec. days | 2 | 2 | 3 | 4 | 1 | 0 | 0 | 0 | 0 | 0 | 2 | 2 |
|---|
| Humidity | 45% | 35% | 30% | 27% | 17% | 10% | 10% | 12% | 14% | 21% | 38% | 46% |
|---|
| Day length | 11 | 11 | 12 | 13 | 13 | 14 | 14 | 13 | 12 | 12 | 11 | 11 |
|---|
| Sun hours | 7 | 8 | 7 | 8 | 9 | 11 | 11 | 10 | 9 | 10 | 9 | 7 |
|---|
|
| Turaif (850 meters) |
|---|
|
| Jan | Feb | Mar | Apr | May | Jun | Jul | Aug | Sep | Oct | Nov | Dec |
|---|
| Min temp. | 2 | 3 | 7 | 11 | 16 | 20 | 22 | 22 | 19 | 15 | 8 | 3 |
|---|
| Max temp. | 13 | 16 | 20 | 26 | 31 | 35 | 38 | 38 | 35 | 29 | 21 | 15 |
|---|
| Precip. | 15 | 10 | 10 | 10 | 5 | 0 | 0 | 0 | 0 | 5 | 10 | 10 |
|---|
| Prec. days | 3 | 3 | 2 | 1 | 1 | 0 | 0 | 0 | 0 | 1 | 2 | 2 |
|---|
| Humidity | 65% | 56% | 44% | 33% | 26% | 22% | 23% | 24% | 26% | 36% | 52% | 64% |
|---|
| Day length | 10 | 11 | 12 | 13 | 14 | 14 | 14 | 13 | 12 | 11 | 10 | 10 |
|---|
| Sun hours | 7 | 8 | 9 | 10 | 12 | 14 | 14 | 14 | 13 | 10 | 8 | 7 |
|---|
|
See also the
temperatures month by month