Select units of measurement for the temperature and rainfall tables (metric or imperial).
Average weather, temperature, rainfall, sunshine
In Yemen, the climate is
tropical desert on the coasts and in the lowlands, while it is
mild and moderately rainy on the western plateau. During summer, from June to September, the
southwest monsoon brings some rainfall on the western highlands, while in the rest of the country, it brings widespread cloudiness but practically no rain.
Yemen is a West Asian country, located in the southern part of the Arabian Peninsula.
The climate in detail
Red Sea coast
Al Hudaydah
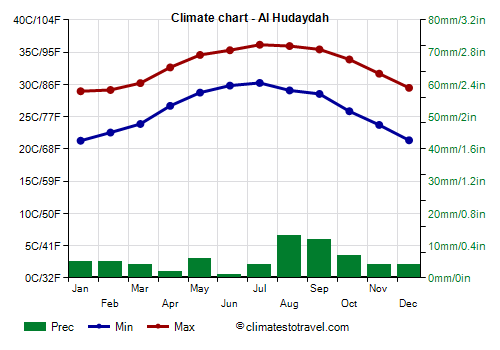
The
coast of the Red Sea (called
Tihamah) has a desert climate, hot all year round, with highs around 28/30 °C (82/86 °F) in winter and 38/40 °C (100/104 °F) in summer. In summer, the humidity from the sea makes the heat sweltering.
In
Al Hudaydah, only 65 millimeters (2.6 inches) of rain fall per year. Despite the few rains, in this region, unhealthy and malarial areas are found because of rivers that descend from the mountains and feed wetlands.
The amount of sunshine, good all year round, decreases a bit in summer because of the cloudiness brought by the southwest monsoon.
The Red Sea is warm enough for swimming all year round, and becomes very warm in summer.
The
islands of the Red Sea (Hanish, Kamaran, Perim) are desert as well, hot in winter and stifling in summer.
Southern Coast
Further east, the
coast of the Gulf of Aden has a similar climate, but it's a bit less hot during summer, especially in the central and eastern part, and this happens because of the aforementioned
south-west monsoon, which is felt more, and brings more often cloudy skies.
Al Mukalla
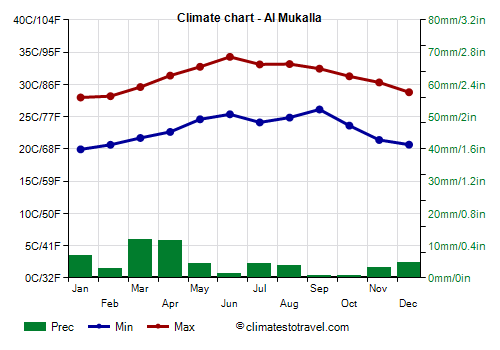
As a result, in
Aden, in the southern part of the coast, the daytime temperature in June and July is about 37 °C (99 °F), and in August and September, it's about 36 °C (97 °F), while in
Al Mukalla, more to the northeast and more exposed to the summer monsoon, it reaches "only" 33/34 °C (91/93 °F) in June and July, with a steady breeze and the sky often cloudy, even though the rains remain sporadic.
However, the rains are still very scarce, even though, in July and August, there can be drizzle which does not fall into the statistics (because, in practice, there is no accumulation).
The sea temperature in the Gulf of Aden is similar to that of the Red Sea, although it's a bit less warm in summer on account of both the wind and the cloudiness brought by the monsoon.
Socotra
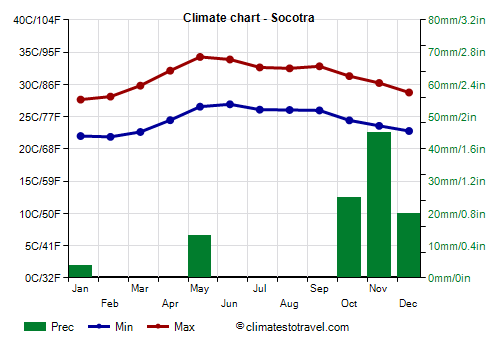
The island of
Socotra, which is located between the Arabian Sea and the Indian Ocean, has a
tropical desert climate, hot all year round, with daytime temperatures around 28/29 °C (82/84 °F) in winter, which rise to 34 °C (93 °F) in May and June, and drop again slightly in summer because of the monsoon.
In Socotra, the
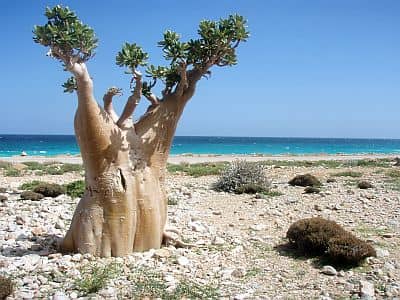
rains are very scarce, at least in the lowlands, while the slopes of
Mount Hajhir are greener, and are home to xerophile vegetation, which is able to withstand the drought. However, from June to September, the island is affected by cloudiness brought by the south-west monsoon, it can receive a few showers, and is often
windy.
In the first months of the northeast Asian monsoon, from October to December, some brief showers can occur, while on mainland it is normally dry.
In Socotra, the sky is often cloudy from mid-June to mid-September, while the sun shines in the rest of the year.
The Arabian Sea in Socotra is warm enough for swimming all year round as well, but in summer, it's not warmer than in winter because of the wind brought by the monsoon, which lowers a bit the temperature; this also applies to the eastern coast of the mainland (see Al Ghaydan).
The plateau
The western plateau has a
mild climate because of the high altitude, but also because it receives
moderate rainfall from the summer monsoon. In Taiz, 760 mm (30 in) of rain fall per year, and in Ibb, up to 1,000 mm (40 inches). The landscape is green in the south-west facing slopes, and with the terrace system, cultivation is possible even on steep terrains. On the highest peaks, above 3,000 meters (9,800 ft), during winter, it can sometimes snow.
Sana'a
The capital,
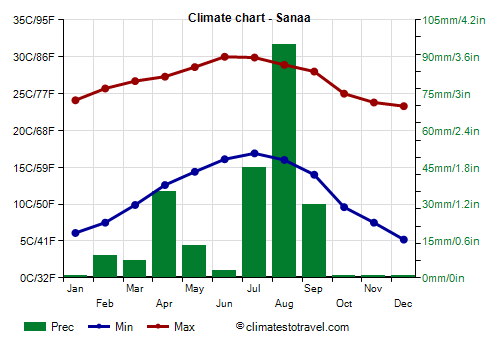
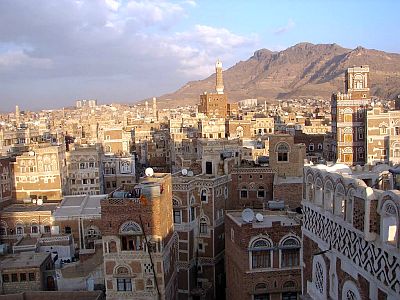
Sana'a, is located at 2,200 meters (7,200 ft) above sea level. Winter is pleasantly warm and sunny during the day, but the temperature at night drops quite a bit, sometimes down to 0 °C (32 °F), especially in December and January. During summer, the temperature is warm: the daily average is about 23 °C (73.5 °F); sometimes, a few downpours or thunderstorms can occur.
Sana'a is located on the eastern side of the plateau, the one that receives less rainfall, and in particular, it's protected by
Jabal an Nabi Shu'ayb, the highest mountain in Yemen, 3,666 meters (12,028 feet) high. However, in Sana'a, 240 mm (9.5 in) of rain fall per year, concentrated from July to September, with a maximum in August of 95 mm (3.7 in): precipitation is therefore typical of a semi-desert climate. A bit of rainfall may actually occur also in spring, from March to May, here as in the rest of the plateau.
In Sana'a, the sun shines all year round, but the hours of sunshine diminish a bit in July and August.
The
central-eastern part of Yemen (formerly South Yemen) is occupied by a coastal range, and in the interior, by a plateau which declines from 1,000 to 400 meters (3,300 to 1,300 feet) from west to east, on the border with Oman; this is a desert area, although some rain in summer is possible along the coastal range.
For instance, in
Sayun (or Seiyun), located at 650 meters (2,100 feet) above sea level, the average temperature ranges from 20 °C (68 °F) in January, with average highs of 27.5 °C (81.5 °F), to 35 °C (95 °F) in July, with average highs of 42 °C (107.5 °F).
In the far north, along the border with Saudi Arabia, there is also a lowland area occupied by the southern tip of the
Rub 'al Khali, the sand desert of southern Arabia. Here, summer is very hot, with highs steadily above 40 °C (104 °F), but a bit of cloudiness brought by the summer monsoon can affect these parts too.
Tropical cyclones
Every now and then, Yemen can be reached by
tropical cyclones, which bring strong winds and heavy rainfall (which can cause flash floods in desert areas, which are not able to absorb water).
For example, this happened with Cyclone Chapala in early November 2015 and with Cyclone Megh in the following days, with Deep Depression ARB 02 in October 2008, with the June 1996 cyclone, and with Cyclone Mekunu in May 2018.
Cyclones form from May to December, and are more frequent at the beginning of the period (May-June) and at the end (October-December). The most affected areas are the island of Socotra, directly exposed in the open sea, and the central-eastern part of the coast, towards the border with Oman, which is hit more easily. On the other hand, once cyclones enter the Gulf of Aden, they tend to weaken, so the western part of the country is more protected.
When to go
The best months to visit Yemen as a whole, the island of Socotra inclusive, are
January and February. Along the coasts and at low altitudes, it's a warm and sunny period, while in the desert, it's pleasant during the day, while it may become a bit cold at night, but at least, you avoid the blistering heat of the long summer months.
In
December, the weather is usually good, but tropical cyclones are still possible, especially in the first half of the month.
In
Sana'a and at high altitudes, winter is equally sunny, but it's mild during the day and a bit cold at night. Owing to the mild temperatures, you can visit Sana'a all year round, but in summer, especially in July and August, it is often cloudy, in addition, some showers, at times heavy, can occur. Certain areas of the plateau are even more rainy and may experience flooding and landslides.
The
plateau can receive some showers also between March and May, however, if you want to visit only the plateau, you can go in
March-April and October-November, in order to avoid either the cold of the winter nights and the summer rains. October is probably the best month.
As mentioned above, the
sea in Yemen is always warm enough for swimming, both in Socotra and along the coasts of the mainland.
What to pack
In
winter: for the plateau and Sana'a, pack spring/autumn clothes (light for the day), a sun hat, a sweater and a jacket for the evening.
For the mountain peaks, bring warm clothes, such as a down jacket, a sweater, gloves, and a hat.
For the coast, bring summer clothes, and a sweatshirt for the evening.
For the desert, light clothes for the day, a scarf or turban, desert boots or sandals, and a sweater or jacket for the evening and early morning.
When going to the reef, you can bring snorkeling equipment, including water shoes or rubber-soled shoes.
In
summer: for the plateau and Sana'a, pack light clothing, a sweatshirt for the evening, and a raincoat or umbrella.
For the mountain tops, spring/autumn clothes for the day, a sweatshirt and a jacket, and a raincoat.
For the desert and the Red Sea coast, lightweight clothes, made of natural fabric (cotton or linen), and a desert turban.
For the coast of the Arabian Sea and Socotra, light clothes, a light sweatshirt and a scarf for the breeze, and a light raincoat.
It's better for women to avoid shorts and miniskirts outside tourist clubs.
Climate data - Yemen
| Al Hudaydah |
|---|
|
| Jan | Feb | Mar | Apr | May | Jun | Jul | Aug | Sep | Oct | Nov | Dec |
|---|
| Min temp. | 21 | 23 | 24 | 27 | 29 | 30 | 30 | 29 | 29 | 26 | 24 | 21 |
|---|
| Max temp. | 29 | 29 | 30 | 33 | 35 | 35 | 36 | 36 | 35 | 34 | 32 | 29 |
|---|
| Precip. | 5 | 5 | 5 | 0 | 5 | 0 | 5 | 15 | 10 | 5 | 5 | 5 |
|---|
|
|
|
| Sun hours | 8 | 8 | 9 | 10 | 11 | 9 | 7 | 8 | 9 | 10 | 10 | 9 |
|---|
| Sea temp | 26 | 26 | 26 | 28 | 30 | 31 | 32 | 32 | 32 | 31 | 28 | 26 |
|---|
| Al Mukalla |
|---|
|
| Jan | Feb | Mar | Apr | May | Jun | Jul | Aug | Sep | Oct | Nov | Dec |
|---|
| Min temp. | 20 | 21 | 22 | 23 | 25 | 25 | 24 | 25 | 26 | 24 | 21 | 21 |
|---|
| Max temp. | 28 | 28 | 30 | 31 | 33 | 34 | 33 | 33 | 32 | 31 | 30 | 29 |
|---|
| Precip. | 5 | 5 | 10 | 10 | 5 | 0 | 5 | 5 | 0 | 0 | 5 | 5 |
|---|
| Prec. days | 1 | 1 | 1 | 1 | 0 | 0 | 1 | 1 | 0 | 0 | 1 | 1 |
|---|
|
|
| Sun hours | 9 | 9 | 9 | 10 | 11 | 9 | 5 | 6 | 8 | 10 | 10 | 10 |
|---|
| Sea temp | 26 | 26 | 27 | 28 | 30 | 31 | 30 | 29 | 30 | 29 | 27 | 26 |
|---|
| Dhamar (2,425 meters) |
|---|
|
| Jan | Feb | Mar | Apr | May | Jun | Jul | Aug | Sep | Oct | Nov | Dec |
|---|
| Min temp. | 4 | 5 | 8 | 10 | 12 | 12 | 13 | 13 | 11 | 8 | 6 | 3 |
|---|
| Max temp. | 22 | 23 | 25 | 25 | 26 | 28 | 27 | 25 | 26 | 23 | 22 | 21 |
|---|
| Precip. | 5 | 10 | 20 | 50 | 45 | 15 | 75 | 110 | 30 | 5 | 10 | 5 |
|---|
|
|
|
|
|
| Ibb (1,900 meters) |
|---|
|
| Jan | Feb | Mar | Apr | May | Jun | Jul | Aug | Sep | Oct | Nov | Dec |
|---|
| Min temp. | 9 | 10 | 13 | 14 | 15 | 15 | 16 | 15 | 13 | 11 | 11 | 9 |
|---|
| Max temp. | 24 | 26 | 27 | 27 | 28 | 28 | 27 | 26 | 27 | 26 | 25 | 24 |
|---|
| Precip. | 5 | 5 | 15 | 15 | 10 | 50 | 150 | 145 | 75 | 30 | 15 | 5 |
|---|
|
|
|
|
|
| Sanaa (2,200 meters) |
|---|
|
| Jan | Feb | Mar | Apr | May | Jun | Jul | Aug | Sep | Oct | Nov | Dec |
|---|
| Min temp. | 6 | 8 | 10 | 13 | 14 | 16 | 17 | 16 | 14 | 10 | 8 | 5 |
|---|
| Max temp. | 24 | 26 | 27 | 27 | 29 | 30 | 30 | 29 | 28 | 25 | 24 | 23 |
|---|
| Precip. | 0 | 10 | 5 | 35 | 15 | 5 | 45 | 95 | 30 | 0 | 0 | 0 |
|---|
| Prec. days | 0 | 2 | 1 | 3 | 2 | 1 | 3 | 6 | 2 | 0 | 0 | 0 |
|---|
|
|
| Sun hours | 8 | 8 | 9 | 9 | 10 | 9 | 6 | 7 | 9 | 10 | 10 | 9 |
|---|
|
| Sayun (650 meters) |
|---|
|
| Jan | Feb | Mar | Apr | May | Jun | Jul | Aug | Sep | Oct | Nov | Dec |
|---|
| Min temp. | 12 | 15 | 18 | 22 | 25 | 26 | 29 | 28 | 25 | 19 | 17 | 14 |
|---|
| Max temp. | 27 | 31 | 34 | 37 | 40 | 42 | 42 | 41 | 39 | 35 | 31 | 29 |
|---|
|
|
|
|
|
| Socotra |
|---|
|
| Jan | Feb | Mar | Apr | May | Jun | Jul | Aug | Sep | Oct | Nov | Dec |
|---|
| Min temp. | 22 | 22 | 23 | 24 | 27 | 27 | 26 | 26 | 26 | 24 | 24 | 23 |
|---|
| Max temp. | 28 | 28 | 30 | 32 | 34 | 34 | 33 | 32 | 33 | 31 | 30 | 29 |
|---|
| Precip. | 5 | 0 | 0 | 0 | 15 | 0 | 0 | 0 | 0 | 25 | 45 | 20 |
|---|
| Prec. days | 2 | 1 | 0 | 0 | 2 | 0 | 0 | 0 | 1 | 3 | 4 | 3 |
|---|
|
|
| Sun hours | 9 | 9 | 10 | 10 | 11 | 8 | 4 | 4 | 8 | 10 | 10 | 10 |
|---|
| Sea temp | 26 | 26 | 27 | 29 | 30 | 28 | 26 | 25 | 26 | 27 | 27 | 26 |
|---|
| Taiz (1,400 meters) |
|---|
|
| Jan | Feb | Mar | Apr | May | Jun | Jul | Aug | Sep | Oct | Nov | Dec |
|---|
| Min temp. | 13 | 13 | 14 | 17 | 19 | 20 | 20 | 19 | 18 | 15 | 14 | 13 |
|---|
| Max temp. | 24 | 26 | 28 | 30 | 31 | 32 | 31 | 30 | 30 | 28 | 26 | 25 |
|---|
| Precip. | 10 | 10 | 35 | 70 | 90 | 75 | 60 | 90 | 110 | 90 | 15 | 5 |
|---|
|
|
|
|
|
See also the
temperatures month by month