Select units of measurement for the temperature and rainfall tables (metric or imperial).
Average weather, temperature, rainfall, sunshine
In Sudan, a country of East Africa located south of the Tropic of Cancer and overlooking the Red Sea, the climate is
desert in the north and on the coast, while it's
semi-desert or semi-arid in the south, which is affected by the summer monsoon.
Rainfall, practically absent in the far north, is still very scarce in the centre, where it slightly exceeds 100 millimeters (4 inches) a year, while it exceeds 700 mm (27.5 in) in the far south.
The climate in detail
Red Sea coast
On the
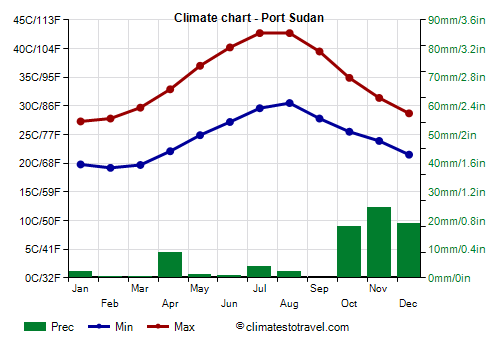
coast of the Red Sea, winter is warm, with highs around 27/28 °C (81/82 °F), while summer is stifling, with a combination of heat and humidity that is hard to bear. The rains, very poor, occur mostly between October and January, in fact, in autumn and winter, the prevailing north-east currents deposit a bit of moisture as precipitation on the coast after passing over the sea.
Port Sudan
In
Port Sudan, the average temperature ranges from 23.5 °C (7.5 °F) in January and February to 36.5 °C (97.5 °F) in August. Here, only 80 mm (3.1 in) of rain fall per year, with a maximum of 25 mm (1 in) in November. So, we are still at desert levels. However, along the coast, an intense downpour or thunderstorm can sometimes occur, which can unload an entire month's rainfall in a few hours.
In Port Sudan, the sun often shines all year round; however, some cloudiness can be formed both in winter and in summer.
The
sea in Sudan is warm all year round, and in summer, when it exceeds 30 °C (86 °F), it becomes one of the warmest seas in the world.
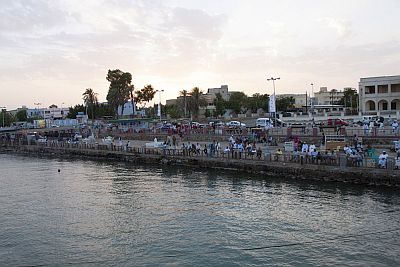
While the coast can be considered a world apart, both because of the higher humidity and because of the rainfall pattern, the
interior of Sudan is desert in the north, and progressively rainier as you move southward, where the rains occur in the summer season.
The north
In the north, occupied by a portion of the
Saharan desert (whose part located to the east of the Nile is called Nubian Desert, while the western part is called Libyan Desert), the climate is
desert, and in particular, the northernmost area, near the border with Egypt, is one of the driest and sunniest in the world.
The
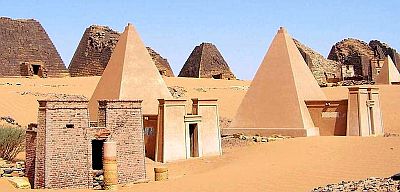
Nubian desert is particularly desolate, devoid of oasis and therefore of settlements, of course, apart from the banks of the Nile, where the remains of the ancient Egyptian and Nubian civilizations are found, as well as more recent settlements.
In winter, temperatures are pleasantly warm during the day and cool at night, even cold at times, especially in the far north, where it can occasionally drop to around freezing (0 °C or 32 °F). The rest of the year is definitely hot, with highs around 40 °C (104 °F) from May to September, but with records of 50/52 °C (122/126 °F). Wind can raise sandstorms at any time of the year.
Wadi Halfa
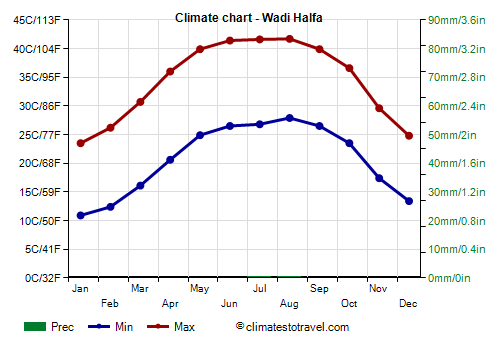
In Wadi Halfa, located in the far north, on the shores of Lake Nasser, the average temperature ranges from 17 °C (63 °F) in January to 35 °C (95 °F) in August.
The sun shines regularly, for almost 3,800 hours a year.
In Wadi Halfa it basically never rains.
More to the south, already at the latitude of the
Bayuda Desert, in the "S" described by the course of the Nile, during summer, there is a slight increase in humidity, a decrease in temperature, and a few rare downpours in July and August, brought by the last offshoots of the summer monsoon.
The center
In the center, it is hot even in winter. Unlike in the north, the hottest period goes from April to June, because later, some clouds and rain arrive, which lower the temperature slightly. However, the climate is still desert or semi-desert.
Khartoum
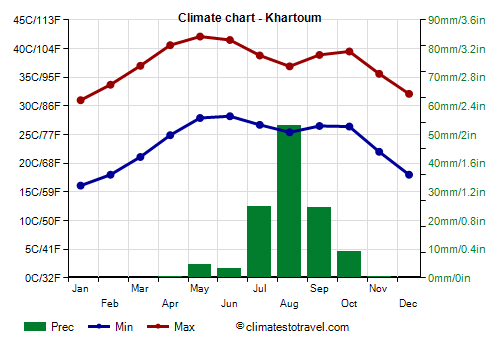
A few hundred kilometers (or miles) to the south, and at the center of the country, we find
Khartoum (Al Khurtum), the capital, located at 400 meters (1,300 feet) above sea level, where the White Nile and the Blue Nile river meet.
With an annual average temperature of 30.5 °C (87 °F), Khartoum is
one of the hottest capitals in the world.
Winter is hot, with highs around 31 °C (88 °F) in January, but it can sometimes get a bit cold at night, in fact, the cold record is 8 °C (46.5 °F). In spring, the temperatures increase rapidly, and they reach 40 °C (104 °F) already in April; in April and May, the temperature have sometimes reached as high as 47 °C (117 °F).
In July and August, under the influence of the monsoon, which brings a bit of rain, the temperature decreases slightly, but it remains very high, around 37/39 °C (99/102 °F), and then, between October and November, at the end of the monsoon, it increases slightly again.
Annual precipitation in the capital is very low, and amounts to 120 mm (4.7 in), with a maximum of 50 mm (2 in) in August. However, due to poor drainage, Khartoum can sometimes be hit by
flash-floods, during intense thunderstorms. Furthermore, in summer, the city can be affected by the overflowing of the two rivers that cross it, caused by rains that occur in the south, in the rainier area.
In Khartoum, the sun shines all year round, but in summer, the hours of sunshine diminish a bit.
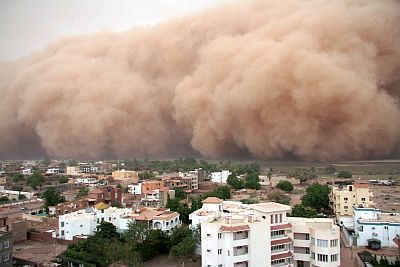
In May or June, when the front of moist air from the south invades the central part of Sudan, it can give rise to a phenomenon called
Haboob, a sand storm that advances like a wall, and then reduces visibility to zero.
In the Western Darfur region lies
Jebel Marra, a mountain range with volcanic craters occupied by lakes, such as
Deriba Caldera, about 3,000 meters (9,800 ft) high. Here, the climate is temperate because of altitude, and since the rains are more abundant, i.e. at the level of the southernmost areas, the landscape is greener than in the surrounding areas.
The south
Continuing
south, annual rainfall increases gradually, reaching 700 mm (27.5 in) in the southernmost part. Almost all of Sudan is practically arid or semi-arid; the greenest area, geographically and culturally different, has been separated in 2011, and gave birth to
South Sudan.
Anyway, in the southernmost part, eg in the
Nuba Mountains, the rainy season is quite long (from May to October, peaking from June to September) and intense, so much so that there is a
savannah-type environment. The climate in the Nuba Mountains, but also in the south-east, in the Dinder National Park, despite the altitude of around 500 meters (1,600 feet), is hot even in winter, with highs around 35 °C (95 °F), while in spring, the temperature rises to around 40 °C (104 °F) and more; the summer is muggy and rainy, while autumn becomes torrid (that is, very hot and dry) again.
During some years, particularly heavy rains in the south can cause
floods.
Nyala
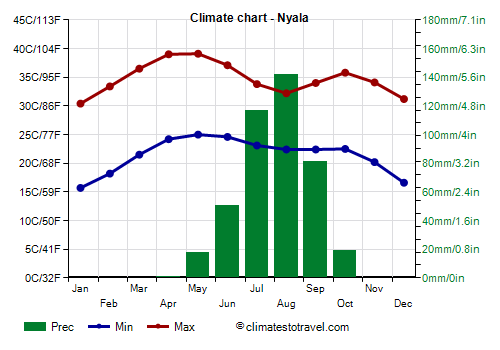
In
Nyala, in South Darfur, at 650 meters (2,100 ft) above sea level, the altitude moderates the heat slightly, so much so that the maximum temperatures reach 39 °C (102 °F), therefore they do not reach 40 °C (104 °F), even in the hottest months, which here are April and May.
In Nyala, 430 mm (17 in) of rain fall per year, with a maximum of more than 100 mm (4 in) in July and August.
In Nyala, cloud cover is a little more frequent than in Khartoum, especially in summer, and in July and August, there are 6/7 hours of sunshine a day.
When to go
The best time to travel to Sudan is
winter, and in particular, the months of December and January. There is sunny weather everywhere, except on the the Red Sea coast, where there can be a bit of cloudiness and some showers. In the south and the east, it's hot during the day, but generally cool at night, while in the north, it can get cold at night.
By February, the temperature begins to rise across the country, and in the south, where it was already intense, it becomes scorching.
What to pack
In
winter: bring light-colored clothing, light and long shirts and pants of natural fibers (cotton, linen), especially in the south, where it is hot even in winter; turban for the desert and the wind from the desert, sunglasses (even graduated instead of contact lenses), a jacket and a sweater for the evening, and desert boots or sandals. For the Red Sea coast, light clothing, a sweatshirt for the evening, and a raincoat or umbrella. When going to the reef, you can bring snorkeling equipment, including water shoes or rubber-soled shoes.
In
summer: for the inland areas, bring lightweight clothes, long and made of natural fabric (cotton or linen), a desert turban; possibly a sweater and a sleeping bag for outdoor overnight stays. For the south, light clothes, a light raincoat or umbrella for the rains, a light sweatshirt. For the Red Sea coast, lightweight clothes. When going to the reef, you can bring snorkeling equipment, including water shoes or rubber-soled shoes. It's better for women to avoid shorts and miniskirts.
Climate data - Sudan
| Abu Hamad (310 meters) |
|---|
|
| Jan | Feb | Mar | Apr | May | Jun | Jul | Aug | Sep | Oct | Nov | Dec |
|---|
| Min temp. | 13 | 14 | 17 | 22 | 26 | 28 | 28 | 29 | 28 | 25 | 20 | 15 |
|---|
| Max temp. | 29 | 31 | 35 | 40 | 43 | 44 | 43 | 43 | 43 | 40 | 34 | 30 |
|---|
| Precip. | 0 | 0 | 0 | 0 | 0 | 0 | 5 | 5 | 0 | 0 | 0 | 0 |
|---|
| Prec. days | 0 | 0 | 0 | 0 | 0 | 0 | 0 | 1 | 0 | 0 | 0 | 0 |
|---|
|
|
| Sun hours | 10 | 10 | 10 | 11 | 10 | 11 | 10 | 10 | 9 | 10 | 10 | 10 |
|---|
|
| Atbara (345 meters) |
|---|
|
| Jan | Feb | Mar | Apr | May | Jun | Jul | Aug | Sep | Oct | Nov | Dec |
|---|
| Min temp. | 15 | 15 | 19 | 23 | 27 | 28 | 28 | 27 | 28 | 26 | 21 | 17 |
|---|
| Max temp. | 31 | 33 | 37 | 41 | 44 | 44 | 42 | 41 | 42 | 40 | 36 | 33 |
|---|
| Precip. | 0 | 0 | 0 | 0 | 5 | 0 | 20 | 25 | 5 | 0 | 0 | 0 |
|---|
| Prec. days | 0 | 0 | 0 | 0 | 1 | 0 | 2 | 3 | 1 | 0 | 0 | 0 |
|---|
|
|
| Sun hours | 10 | 10 | 10 | 11 | 10 | 9 | 9 | 9 | 9 | 10 | 10 | 10 |
|---|
|
| Dongola (225 meters) |
|---|
|
| Jan | Feb | Mar | Apr | May | Jun | Jul | Aug | Sep | Oct | Nov | Dec |
|---|
| Min temp. | 12 | 13 | 15 | 20 | 24 | 25 | 27 | 28 | 27 | 23 | 16 | 12 |
|---|
| Max temp. | 28 | 30 | 34 | 39 | 43 | 43 | 43 | 43 | 42 | 39 | 33 | 29 |
|---|
| Precip. | 0 | 0 | 0 | 0 | 0 | 0 | 0 | 5 | 10 | 0 | 0 | 0 |
|---|
| Prec. days | 0 | 0 | 0 | 0 | 0 | 0 | 0 | 1 | 0 | 0 | 0 | 0 |
|---|
|
|
| Sun hours | 10 | 10 | 10 | 11 | 10 | 11 | 11 | 11 | 10 | 10 | 10 | 10 |
|---|
|
| El Fasher (735 meters) |
|---|
|
| Jan | Feb | Mar | Apr | May | Jun | Jul | Aug | Sep | Oct | Nov | Dec |
|---|
| Min temp. | 11 | 14 | 18 | 21 | 25 | 24 | 24 | 24 | 23 | 21 | 16 | 12 |
|---|
| Max temp. | 30 | 32 | 35 | 39 | 39 | 39 | 36 | 34 | 35 | 36 | 33 | 30 |
|---|
| Precip. | 0 | 0 | 0 | 0 | 5 | 15 | 60 | 85 | 35 | 5 | 0 | 0 |
|---|
| Prec. days | 0 | 0 | 0 | 0 | 1 | 2 | 8 | 9 | 4 | 1 | 0 | 0 |
|---|
|
|
| Sun hours | 10 | 10 | 10 | 10 | 10 | 8 | 8 | 7 | 8 | 10 | 10 | 10 |
|---|
|
| El-Obeid (575 meters) |
|---|
|
| Jan | Feb | Mar | Apr | May | Jun | Jul | Aug | Sep | Oct | Nov | Dec |
|---|
| Min temp. | 16 | 17 | 21 | 24 | 26 | 25 | 24 | 23 | 22 | 23 | 20 | 17 |
|---|
| Max temp. | 30 | 32 | 36 | 39 | 39 | 38 | 34 | 32 | 34 | 36 | 35 | 31 |
|---|
| Precip. | 0 | 0 | 0 | 0 | 10 | 20 | 100 | 110 | 60 | 15 | 0 | 0 |
|---|
| Prec. days | 0 | 0 | 0 | 0 | 2 | 4 | 10 | 10 | 6 | 2 | 0 | 0 |
|---|
|
|
| Sun hours | 10 | 10 | 10 | 10 | 10 | 8 | 7 | 7 | 8 | 9 | 10 | 10 |
|---|
|
| Gedaref (600 meters) |
|---|
|
| Jan | Feb | Mar | Apr | May | Jun | Jul | Aug | Sep | Oct | Nov | Dec |
|---|
| Min temp. | 18 | 19 | 22 | 25 | 26 | 25 | 23 | 22 | 23 | 23 | 22 | 19 |
|---|
| Max temp. | 35 | 37 | 40 | 42 | 42 | 39 | 35 | 33 | 35 | 36 | 38 | 36 |
|---|
| Precip. | 0 | 0 | 0 | 5 | 20 | 90 | 185 | 185 | 85 | 30 | 5 | 0 |
|---|
| Prec. days | 0 | 0 | 0 | 1 | 5 | 10 | 11 | 14 | 8 | 4 | 1 | 0 |
|---|
|
|
| Sun hours | 10 | 10 | 10 | 10 | 10 | 9 | 8 | 8 | 9 | 9 | 10 | 10 |
|---|
|
| Geneina (805 meters) |
|---|
|
| Jan | Feb | Mar | Apr | May | Jun | Jul | Aug | Sep | Oct | Nov | Dec |
|---|
| Min temp. | 12 | 14 | 20 | 23 | 24 | 23 | 21 | 21 | 20 | 20 | 17 | 14 |
|---|
| Max temp. | 30 | 33 | 36 | 39 | 40 | 38 | 33 | 31 | 34 | 35 | 34 | 32 |
|---|
| Precip. | 0 | 0 | 0 | 5 | 15 | 45 | 165 | 215 | 65 | 10 | 0 | 0 |
|---|
| Prec. days | 0 | 0 | 0 | 1 | 2 | 6 | 14 | 16 | 7 | 2 | 0 | 0 |
|---|
|
|
| Sun hours | 10 | 10 | 10 | 10 | 10 | 9 | 7 | 7 | 8 | 10 | 10 | 10 |
|---|
|
| Kadugli (500 meters) |
|---|
|
| Jan | Feb | Mar | Apr | May | Jun | Jul | Aug | Sep | Oct | Nov | Dec |
|---|
| Min temp. | 17 | 20 | 22 | 24 | 24 | 22 | 21 | 21 | 21 | 21 | 19 | 19 |
|---|
| Max temp. | 35 | 37 | 39 | 41 | 39 | 35 | 32 | 31 | 32 | 36 | 37 | 35 |
|---|
| Precip. | 0 | 0 | 5 | 10 | 60 | 100 | 135 | 165 | 100 | 60 | 0 | 0 |
|---|
| Prec. days | 0 | 0 | 0 | 1 | 6 | 9 | 13 | 15 | 11 | 6 | 0 | 0 |
|---|
|
|
| Sun hours | 10 | 10 | 9 | 9 | 9 | 8 | 6 | 6 | 6 | 8 | 10 | 10 |
|---|
|
| Kassala (500 meters) |
|---|
|
| Jan | Feb | Mar | Apr | May | Jun | Jul | Aug | Sep | Oct | Nov | Dec |
|---|
| Min temp. | 17 | 18 | 21 | 25 | 27 | 27 | 24 | 23 | 25 | 25 | 22 | 19 |
|---|
| Max temp. | 34 | 35 | 38 | 41 | 42 | 40 | 36 | 34 | 37 | 39 | 38 | 35 |
|---|
| Precip. | 0 | 0 | 0 | 0 | 10 | 30 | 75 | 85 | 40 | 10 | 0 | 0 |
|---|
| Prec. days | 0 | 0 | 0 | 1 | 2 | 4 | 8 | 9 | 4 | 2 | 0 | 0 |
|---|
|
|
| Sun hours | 10 | 10 | 10 | 10 | 10 | 9 | 9 | 9 | 10 | 10 | 10 | 10 |
|---|
|
| Khartoum (400 meters) |
|---|
|
| Jan | Feb | Mar | Apr | May | Jun | Jul | Aug | Sep | Oct | Nov | Dec |
|---|
| Min temp. | 16 | 18 | 21 | 25 | 28 | 28 | 27 | 25 | 26 | 26 | 22 | 18 |
|---|
| Max temp. | 31 | 34 | 37 | 41 | 42 | 42 | 39 | 37 | 39 | 40 | 36 | 32 |
|---|
| Precip. | 0 | 0 | 0 | 0 | 5 | 5 | 25 | 55 | 25 | 10 | 0 | 0 |
|---|
| Prec. days | 0 | 0 | 0 | 0 | 1 | 1 | 3 | 5 | 2 | 1 | 0 | 0 |
|---|
| Humidity | 24% | 18% | 13% | 13% | 17% | 23% | 39% | 51% | 42% | 28% | 23% | 28% |
|---|
| Day length | 11 | 12 | 12 | 12 | 13 | 13 | 13 | 13 | 12 | 12 | 11 | 11 |
|---|
| Sun hours | 10 | 10 | 10 | 10 | 9 | 8 | 7 | 7 | 8 | 10 | 10 | 10 |
|---|
|
| Kosti (380 meters) |
|---|
|
| Jan | Feb | Mar | Apr | May | Jun | Jul | Aug | Sep | Oct | Nov | Dec |
|---|
| Min temp. | 16 | 18 | 20 | 24 | 26 | 27 | 24 | 23 | 24 | 25 | 21 | 18 |
|---|
| Max temp. | 34 | 35 | 39 | 42 | 42 | 40 | 35 | 34 | 36 | 38 | 37 | 34 |
|---|
| Precip. | 0 | 0 | 0 | 0 | 15 | 45 | 100 | 120 | 60 | 10 | 0 | 0 |
|---|
| Prec. days | 0 | 0 | 0 | 0 | 2 | 5 | 10 | 12 | 7 | 2 | 0 | 0 |
|---|
|
|
| Sun hours | 10 | 10 | 10 | 10 | 10 | 8 | 7 | 7 | 8 | 9 | 10 | 10 |
|---|
|
| Nyala (650 meters) |
|---|
|
| Jan | Feb | Mar | Apr | May | Jun | Jul | Aug | Sep | Oct | Nov | Dec |
|---|
| Min temp. | 16 | 18 | 22 | 24 | 25 | 25 | 23 | 22 | 22 | 22 | 20 | 17 |
|---|
| Max temp. | 30 | 33 | 36 | 39 | 39 | 37 | 34 | 32 | 34 | 36 | 34 | 31 |
|---|
| Precip. | 0 | 0 | 0 | 0 | 20 | 50 | 115 | 140 | 80 | 20 | 0 | 0 |
|---|
| Prec. days | 0 | 0 | 0 | 0 | 2 | 4 | 9 | 10 | 6 | 2 | 0 | 0 |
|---|
|
|
| Sun hours | 9 | 9 | 8 | 8 | 8 | 7 | 6 | 6 | 7 | 9 | 10 | 10 |
|---|
|
| Port Sudan |
|---|
|
| Jan | Feb | Mar | Apr | May | Jun | Jul | Aug | Sep | Oct | Nov | Dec |
|---|
| Min temp. | 20 | 19 | 20 | 22 | 25 | 27 | 30 | 30 | 28 | 26 | 24 | 22 |
|---|
| Max temp. | 27 | 28 | 30 | 33 | 37 | 40 | 43 | 43 | 40 | 35 | 31 | 29 |
|---|
| Precip. | 0 | 0 | 0 | 10 | 0 | 0 | 5 | 0 | 0 | 20 | 25 | 20 |
|---|
| Prec. days | 0 | 0 | 0 | 0 | 0 | 0 | 1 | 0 | 0 | 1 | 2 | 1 |
|---|
|
|
| Sun hours | 6 | 7 | 9 | 10 | 10 | 9 | 7 | 7 | 9 | 9 | 8 | 6 |
|---|
| Sea temp | 26 | 26 | 26 | 27 | 29 | 30 | 31 | 31 | 31 | 31 | 30 | 28 |
|---|
| Wadi Halfa |
|---|
|
| Jan | Feb | Mar | Apr | May | Jun | Jul | Aug | Sep | Oct | Nov | Dec |
|---|
| Min temp. | 11 | 12 | 16 | 21 | 25 | 26 | 27 | 28 | 26 | 24 | 17 | 13 |
|---|
| Max temp. | 24 | 26 | 31 | 36 | 40 | 41 | 42 | 42 | 40 | 37 | 30 | 25 |
|---|
| Precip. | 0 | 0 | 0 | 0 | 0 | 0 | 0 | 0 | 0 | 0 | 0 | 0 |
|---|
| Prec. days | 0 | 0 | 0 | 0 | 0 | 0 | 0 | 0 | 0 | 0 | 0 | 0 |
|---|
|
|
| Sun hours | 10 | 10 | 10 | 10 | 10 | 11 | 11 | 11 | 10 | 10 | 10 | 11 |
|---|
|
See also the
temperatures month by month