Select units of measurement for the temperature and rainfall tables (metric or imperial).
Average weather, temperature, rainfall, sunshine hours

In Dammam, the climate is
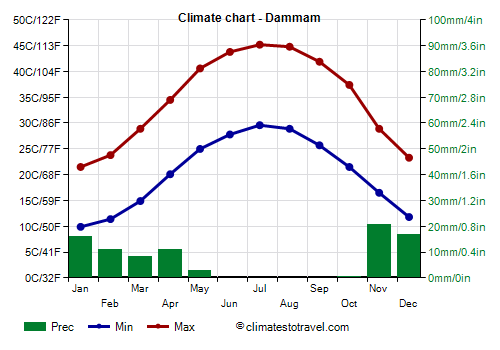
desert, with very mild winters, from December to February, and very hot, sunny summers, with highs above 40 °C (104 °F) from May to September. The rains, very scarce and irregular from one year to another, occur almost all from November to April. The sun shines all year round.
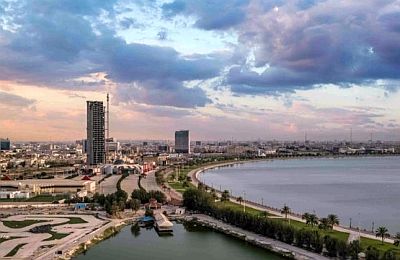
The city is located in eastern Saudi Arabia, on the coast of the Persian Gulf (or Arabian Gulf), at 26 degrees north latitude.
The metropolitan area also includes the cities of
Dhahran and
Khobar. The latter is connected by the King Fahd Causeway to the small island country of
Bahrain, which is located across a small stretch of sea.
 Winter
, from December to February, is very mild or pleasantly warm, with many days in which good weather prevails. However, clashes between air masses can bring rain and thunderstorms, sometimes accompanied by hail. Every now and then, there may be some thunderstorms that are more intense than usual, which can even cause flooding.
Furthermore, the north wind can bring very cool periods, sometimes even a bit cold, and windy. On the coldest nights of the year, the temperature typically drops to around 5 °C (41 °F), but can occasionally drop lower. In January 2008 it dropped to 1 °C (34 °F), and there were three days with a maximum of 10/11 °C (50/52 °F).
In
summer, the prevailing wind, the
Shamal, blows from the northwest, and is sometimes able to raise sandstorms. This wind is more intense in June, and then gradually decreases, so much so that in August and September the average humidity is higher, and the risk of days with weaker winds and sultry heat increases, which is difficult to bear with these temperatures.
On the hottest days of the year, the temperature generally reaches 49/50 °C (120/122 °F). The hottest record is 51 °C (124 °F).
In this area, the sea in winter is a little cool for swimming, while in summer it becomes very warm, the warmest in the world.
Dammam - Climate data
In Dammam, the
average temperature of the coldest month (January) is of
15.7 °C, that of the warmest month (July) is of
37.4 °C. Here are the average temperatures.
Dammam - Average temperatures (1991-2020) |
| Month | Min | Max | Mean |
|---|
| January | 9.9 | 21.5 | 15.7 |
|---|
| February | 11.4 | 23.8 | 17.6 |
|---|
| March | 14.9 | 28.9 | 21.9 |
|---|
| April | 20.1 | 34.5 | 27.3 |
|---|
| May | 25 | 40.6 | 32.8 |
|---|
| June | 27.8 | 43.8 | 35.8 |
|---|
| July | 29.6 | 45.2 | 37.4 |
|---|
| August | 28.9 | 44.8 | 36.8 |
|---|
| September | 25.7 | 41.9 | 33.8 |
|---|
| October | 21.5 | 37.4 | 29.4 |
|---|
| November | 16.5 | 28.9 | 22.7 |
|---|
| December | 11.8 | 23.3 | 17.6 |
|---|
| Year | 20.3 | 34.6 | 27.4 |
|---|
amounts to
85 millimeters per year: it is therefore at a desert level. It ranges from
0 millimeters in the driest months (June, July, August, September) to
20.7 millimeters in the wettest one (November). Here is the average precipitation.
Dammam - Average precipitation| Month | Days |
|---|
| January | 16 | 2 |
|---|
| February | 11 | 2 |
|---|
| March | 8 | 2 |
|---|
| April | 11 | 2 |
|---|
| May | 3 | 0 |
|---|
| June | 0 | 0 |
|---|
| July | 0 | 0 |
|---|
| August | 0 | 0 |
|---|
| September | 0 | 0 |
|---|
| October | 0 | 0 |
|---|
| November | 21 | 2 |
|---|
| December | 17 | 2 |
|---|
| Year | 85 | 13 |
|---|
The
sea temperature ranges from
19.5 °C in February to
33.5 °C in August. Here are the average sea temperatures.
Dammam - Sea temperature| Month |
|---|
| January | 21 |
|---|
| February | 19.5 |
|---|
| March | 20.5 |
|---|
| April | 23 |
|---|
| May | 27 |
|---|
| June | 30 |
|---|
| July | 32 |
|---|
| August | 33.5 |
|---|
| September | 32.5 |
|---|
| October | 30.5 |
|---|
| November | 27.5"> |
|---|
| December | 23.5 |
|---|
| Year | 26.8 |
|---|
There are on average around 3585
sunshine hours per year. Here are the average hours of sunshine per day.
Dammam - Sunshine hours| Month | Average | Total |
|---|
| January | 8 | 250 |
|---|
| February | 8.5 | 235 |
|---|
| March | 8.5 | 255 |
|---|
| April | 9 | 275 |
|---|
| May | 10.5 | 325 |
|---|
| June | 12 | 355 |
|---|
| July | 11.5 | 350 |
|---|
| August | 11.5 | 350 |
|---|
| September | 11 | 330 |
|---|
| October | 10.5 | 325 |
|---|
| November | 9.5 | 280 |
|---|
| December | 8 | 250 |
|---|
| Year | 9.8 | 3585 |
|---|