Select units of measurement for the temperature and rainfall tables (metric or imperial).
Average weather, temperature, rainfall, sunshine
Madagascar is a large island located in the Indian Ocean, and has a
tropical climate, rainy along the east coast and arid in the south-west.
On the inland plateau and in the mountains, the climate is instead
subtropical, gradually milder (and colder on winter nights) as the altitude increases.
In fact, in the interior, there are
mountain ranges that mitigate the climate, while rainfall varies depending on slope exposure.
Being in the Southern Hemisphere, the country has reversed seasons compared with Europe or North America.
The country is very interesting, not only for the beauty of the landscapes, but also for its flora and fauna. In fact, having been separated from the African continent millions of years ago, it has a great biodiversity and many native species.
The climate in detail
The seasons
In
winter, from May to September, the south-east trade winds prevail throughout the country. This is typically a dry season everywhere, except on the east coast, which receives the wind directly from the sea.
In fact, in most of the country, there is a
dry season from April to October (or from May to September in the north), except on the east coast, where it rains all year round.
The
summer, from November to March, is the
rainy season. In the north, the
northwest monsoon prevails, bringing abundant rainfall especially along the north-west facing coast.
However, the rainy season is not felt much in the southwest, where the
southeast trade winds prevail even in the austral summer. Indeed, the coast facing south-west has an arid climate.
As is typical of tropical areas, the
rains usually occur in the form of thunderstorms, especially in the afternoon, so there's no shortage of sunshine even in the wettest months, at least in the morning hours.
In the cool period, from mid-May to September, but sometimes also in October,
cool air masses from the south-west can affect the country, bringing a bit of cool weather at night, especially in the center-south, and even cold in inland areas.
The far north

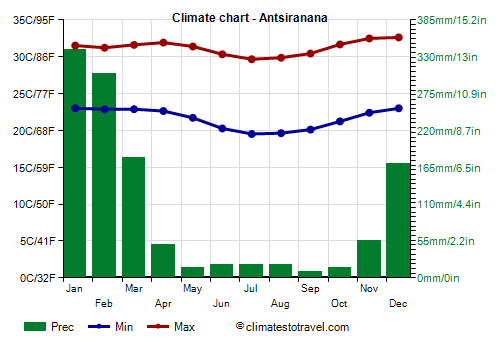
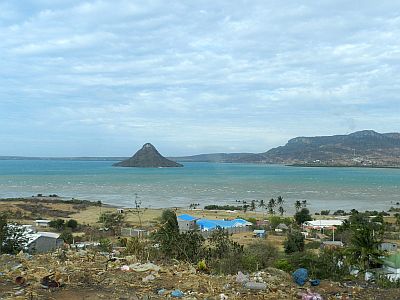
In the far north, in the northern tip of Madagascar (see
Antsiranana), the climate is
hot all year round, although the temperatures slightly drop from June to September, when highs drop to around 29/30 °C (84/86 °F).
The rains are quite contained, hovering around 900/1,100 millimeters (35/43 inches) per year, and are abundant only from December to March.
The sun regularly shines in the long dry season, while in the summer rainy season, the sunshine hours decrease a little.
The sea temperature remains high enough for swimming even in winter, since it only drops to 25 °C (77 °F) from July to September.
North-west coast

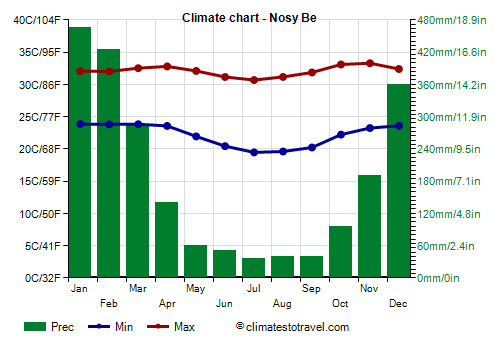
On the north-west coast too, temperatures are high all year round, and decrease slightly in the southern hemisphere winter. In
Nosy-Be, an island located a short distance from the coast where Ambanja is located, highs drop to around 29.5/30 °C (85/86 °F) in July and August.
However, as this coast is directly exposed to the northwest monsoon,
the rains are more abundant, especially in the period
November-March, which in addition to being the rainiest, is also the most hot and muggy. Nosy Be receives 1,730 mm (68 in) of rain per year, including more than 300 mm (11.8 in) per month from December to February.
The sun in Nosy Be shines very often in the dry period, from May to October. On average, there are almost 3,000 sunshine hours per year.
In this part of the coast too, the sea temperature is high throughout the year.
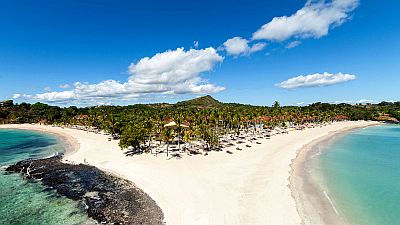
Going further south on the north-western coast, in
Mahajanga, the climate remains similar, even though the rainfall is less abundant, 1,375 mm (54 in) per year. The summer remains very rainy, but it's a little shorter. Moreover, for a long period, from May to October, it almost never rains.
In Mahajanga, it's hot all year round, but the temperature drops a little from June to September, especially at night.
The sky is normally clear in the long dry season, while the sunshine hours decrease a little in the rainy season. There are as high as 3,200 sunshine hours per year.
West Coast

On the
west coast, the temperatures in the austral winter decrease, becoming cool during the night. Furthermore, the west coast is
less rainy than the north-west coast, in fact, the rainfall hovers between 700 and 1,000 mm (27 and 40 in) per year, compared with the 1,500/2,000 mm (60/80 in) of the northwest coast.
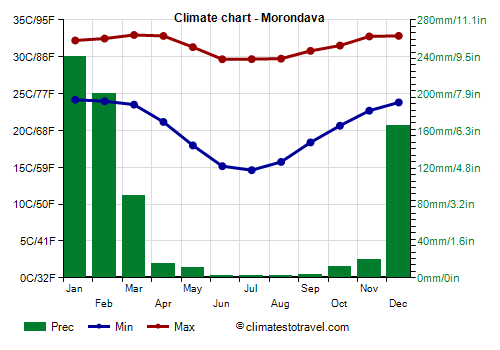
In
Morondava, the average temperature ranges from 28 °C (82.5 °F) in the December-February period to 22/22.5 °C (71.5/72.5 °F) in the June-August period.
Precipitation amounts to 710 mm (28 in) per year; the rains are abundant for a short period, from December to February, while there is a very long dry season, from April to November, when it almost never rains.
The sun in Morondava shines very often, and it shines for many hours even in the rainy season. In an average year, there are as many as 3,500 hours of sunshine.
The sea temperature remains high enough for swimming even in winter, since it drops to 25 °C (77 °F) from July to September.
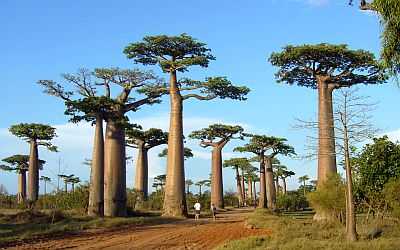
Near Morondava, we find the famous Avenue of the Baobabs.
Arid south-west

On the south-western coast, rainfall diminish further, so much so that it drops below 500 mm (20 in) per year. Therefore, here the climate is
arid. In fact, as mentioned, in the austral summer, the south-east trade winds still blow in the south of the country, bringing rainfall along the eastern side, but it is much less intense in the south-west.
On the other hand, in summer, the southwest is
the hottest area of the country, and the temperature can reach 40 °C (104 °F) from December to March.
In winter, in contrast,
temperatures drop quite sharply, especially at night, when it gets cool. This also happens because, from June to September, and sometimes even in May and October, this area is directly exposed to
cool air masses that may come from South Africa.
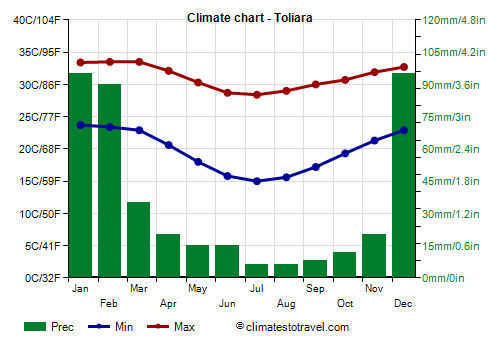
In
Toliara (formerly Tulear), just north of the Tropic of Cancer, only 360 mm (14 in) of rain fall per year, with a maximum of around 90 mm (3.5 in) per month from December to February.
Night temperatures are quite cool from June to August, when they drop to 15/16 °C, while daytime temperatures are very high from December to March, when they reach 33 °C (91.5 °F).
The sun in Toliara regularly shines throughout the year, so, the amount of sunshine remains very good even in summer; there are up to 3,600 hours of sunshine a year.
The temperature of the sea in the southern part of the coast drops to 23.5 °C (74.5 °F) in July and August, so, all in all, it remains warm enough to swim in even in the winter season.
East Coast

As mentioned, during winter, the south-east
trade winds prevail, and they are cool and dry everywhere except along the
east coast, where they release the moisture which they have previously picked up over the ocean. For this reason, on the east coast and on the first slopes near the coast,
it rains throughout the year, and a tropical forest flourishes there.
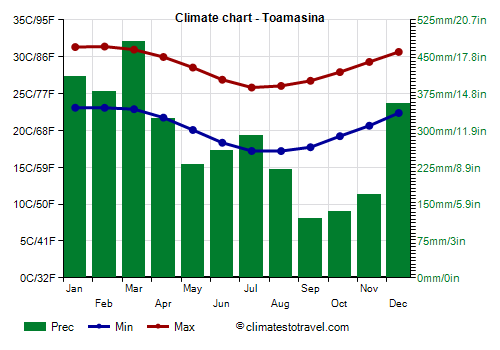
In
Toamasina (formerly Tamatave), 3,200 millimeters (126 inches) of rain fall per year. In March, which is the rainiest month, rainfall exceeds 450 mm (17.5 in). The only period when the rains are not too heavy is from September to November, and this is true in general for the entire east coast.
During the austral winter, the temperature decreases, in fact the maximum temperatures from June to August are around 25/26 °C (77/79 °F).
On the east coast, the sun shines less often than in the rest of the country, and in Toamasina there are 2,400 hours of sunshine per year.
The sea temperature on the east coast is high enough for swimming all year round, although it decreases a little from July to October, reaching 24/25 °C (75/77 °F).
To the north of Toamasina, we find an island,
Sainte-Marie, otherwise called Nosy Boraha, which is located in this very rainy area and is covered by forests.
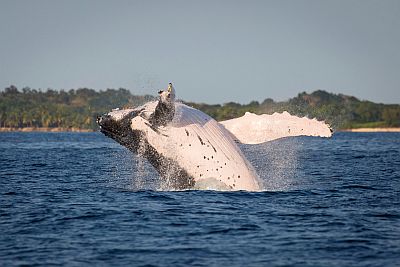
Between July and September, the humpback whales that come from the Antarctic seas and congregate for breeding in the channel between the island of Sainte-Marie and the coast of Madagascar, are often observed in a rainy context. Near Île Sainte-Marie, there is another smaller island, Île aux Nattes (or Nosy Nato).
Along the east coast to the south of Toamasina, precipitation decreases gradually, even though the trend is similar, with rains distributed throughout the year, and a relative minimum in September and October. So, rainfall amounts to 2,000 mm (78 in) in
Mahanoro.
In the southernmost part of the east coast, in
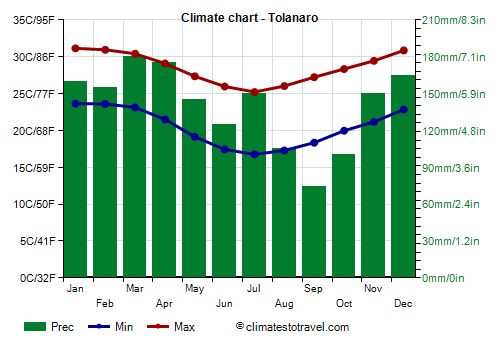
Tolanaro (or Fort Dauphin), rainfall drops to 1,555 mm (61 in) per year; it remains below 250 mm (10 in) in every month, and drops below 80 mm (3.1 in) per month from August to October.
Average temperatures in Tôlanaro do not vary by much compared to those of Toamasina, however, the June-August period can be a bit cool for a beach holiday.
Since the rains are less frequent in winter, the amount of sunshine in Tolanaro does not decrease much, so there are 7/8 hours of sunshine a day even in the period from June to September.
The sea remains warm enough to swim in even in winter, although it decreases to 23/24 °C (73/75 °F) from June to October.
Inland areas

As mentioned, in the interior of the country, the climate is
tempered by altitude, at least at intermediate elevations.
In the dry season, the
wind, able to raise dust from the parched ground can sometimes blow on the plateau. On the other hand, in the rainy season, the rains can make it difficult to get around on unpaved roads.
In the interior, there are also
mountains. The highest mountain is
Maromokotro, 2,876 meters (9,436 feet), located in the north of the island, in the Tsaratanana Massif. On the other hand, in the south, to the south of Fianarantsoa, in the Andringitra National Park, the highest mountains reach around 2,500 meters (8,200 feet).
Above 2,000 meters (6,500 feet), the temperature during winter can drop below freezing (0 °C or 32 °F), especially in the south.
The capital,
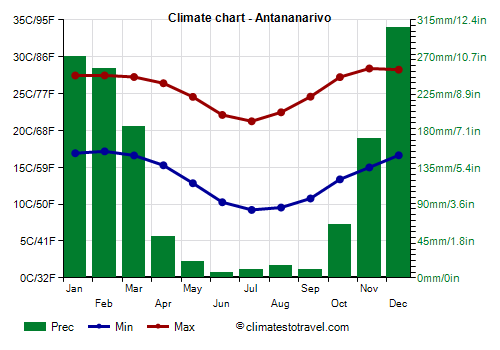
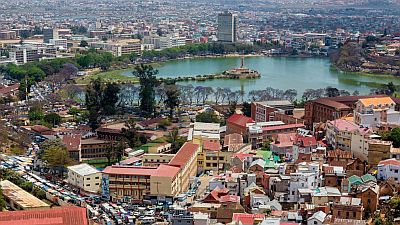
Antananarivo (formerly Tananarive), is located at 1,300 meters (4,300 feet) above sea level, and has a pleasant climate, in fact, the average ranges from 22 °C (71.5 °F) in the summer months to 15.5 °C (60 °F) in July. Winter is therefore pretty cool. Here, the best months are April, September and October.
In Antananarivo, 1,150 mm (45 in) of rain fall per year, most of which occurring from November to March.
In Antananarivo, the amount of sunshine is moderate; however, it reaches a maximum from September to November.
Further south, in
Fianarantsoa, at 1,200 meters (3,900 feet), the climate is similar to that of Antananarivo, while in
Antsirabe, at 1,500 metres (4,900 ft), it is a little cooler.
Tropical cyclones
In the warm season, Madagascar may be affected by
tropical cyclones, which can form in the South-West Indian Ocean from November to mid-May, although they are more likely from late December to mid-April.
Some intense cyclones that hit Madagascar were Gafilo in March 2004, Giovanna in February 2012, Enawo in March 2017, Idai in march 2019, and Batsirai in February 2022.
When to go
The best time to visit the whole Madagascar, to go on
excursions in search of the numerous flora and fauna attractions, corresponds to the months of
September and October: in this way, you can avoid the heat but also the rains and the possible cyclones of the austral summer.
The period from
June to August can be good as well, although it's very rainy on the east coast, and can be cold in inland and southern areas (however, as we said, sometimes it can get a little cold also in September, and more rarely, in October).
For a
beach holiday, the west coast is preferable to the east coast because it's sunnier and less rainy. Anyway, you can go from mid-May to October on the west coast, and in September and October on the east coast.
As regards to the
west coast, you can distinguish between the northern part, the one facing north-west (see Mahajanga, Nosy-Be, Antsiranana), which is warm throughout the year, and the central-southern part, which, in winter, can sometimes be reached by cool air masses from the south and can experience cold nights (see Toliara); therefore, in the latter it's preferable to go in September and October, while if you intend to go in July or August, in order to avoid surprises, you can choose the northernmost area. In Nosy-Be, you can go from mid-May to October, although in October a little atmospheric instability begins to occur, with the first afternoon thunderstorms.
If you prefer to go in
summer, for example at Christmas, it being understood that the weather is hot and there is the risk of cyclones, you can choose the least rainy area, that is, the south-west (see Toliara); in the southern part of the east coast (see Fort Dauphin), all in all, it does not rain very much, even though it depends on the year.
What to pack
In
winter (June to August): on the south-central and the eastern coast, bring spring/autumn clothes (light for the day), a sweater and a light jacket for the evening; on the east coast, you can add a raincoat or umbrella. On the north coast (Mahajanga, Nosy Be), bring light clothing, a sweatshirt for the evening, and a scarf for the breeze. In Antananarivo and the plateau, spring/autumn clothes, a jacket, a sweater and a hat for the evening, and a scarf for the wind.
When going to the reef, you can bring snorkeling equipment, including water shoes or rubber-soled shoes.
In
summer (December to February): throughout the coasts and inland areas at low altitudes, bring light clothing made of natural fibers, a sun hat, a light sweatshirt for the evening, and a light raincoat or umbrella. In Antananarivo and the plateau, light clothes for the day, a sweatshirt and a light jacket for the evening, and a raincoat or umbrella.
Climate data - Madagascar
| Antananarivo (1,250 meters) |
|---|
|
| Jan | Feb | Mar | Apr | May | Jun | Jul | Aug | Sep | Oct | Nov | Dec |
|---|
| Min temp. | 17 | 18 | 17 | 16 | 14 | 12 | 11 | 11 | 12 | 14 | 16 | 17 |
|---|
| Max temp. | 26 | 26 | 26 | 26 | 24 | 21 | 20 | 22 | 24 | 26 | 27 | 27 |
|---|
| Precip. | 310 | 235 | 155 | 45 | 15 | 5 | 5 | 5 | 10 | 40 | 115 | 225 |
|---|
| Prec. days | 17 | 14 | 11 | 4 | 2 | 1 | 1 | 1 | 1 | 4 | 9 | 14 |
|---|
| Humidity | 82% | 81% | 81% | 78% | 78% | 78% | 77% | 73% | 68% | 67% | 71% | 77% |
|---|
| Day length | 13 | 13 | 12 | 12 | 11 | 11 | 11 | 12 | 12 | 12 | 13 | 13 |
|---|
| Sun hours | 7 | 6 | 6 | 7 | 7 | 7 | 7 | 8 | 8 | 8 | 8 | 6 |
|---|
|
| Antsiranana |
|---|
|
| Jan | Feb | Mar | Apr | May | Jun | Jul | Aug | Sep | Oct | Nov | Dec |
|---|
| Min temp. | 23 | 23 | 23 | 23 | 22 | 20 | 20 | 20 | 20 | 21 | 22 | 23 |
|---|
| Max temp. | 31 | 31 | 31 | 32 | 31 | 30 | 29 | 29 | 30 | 31 | 32 | 32 |
|---|
| Precip. | 240 | 245 | 160 | 55 | 15 | 15 | 15 | 10 | 10 | 15 | 30 | 135 |
|---|
| Prec. days | 15 | 15 | 11 | 5 | 2 | 3 | 3 | 2 | 2 | 3 | 4 | 9 |
|---|
| Humidity | 78% | 81% | 78% | 72% | 67% | 63% | 61% | 60% | 60% | 63% | 65% | 71% |
|---|
| Day length | 13 | 12 | 12 | 12 | 12 | 11 | 12 | 12 | 12 | 12 | 13 | 13 |
|---|
| Sun hours | 6 | 6 | 7 | 9 | 9 | 9 | 9 | 9 | 10 | 10 | 9 | 7 |
|---|
| Sea temp | 29 | 29 | 29 | 29 | 28 | 26 | 25 | 25 | 25 | 26 | 27 | 28 |
|---|
| Mahajanga |
|---|
|
| Jan | Feb | Mar | Apr | May | Jun | Jul | Aug | Sep | Oct | Nov | Dec |
|---|
| Min temp. | 24 | 24 | 24 | 24 | 22 | 20 | 19 | 19 | 20 | 22 | 24 | 24 |
|---|
| Max temp. | 31 | 32 | 33 | 33 | 33 | 32 | 31 | 32 | 33 | 33 | 33 | 32 |
|---|
| Precip. | 485 | 330 | 185 | 50 | 5 | 0 | 0 | 0 | 0 | 15 | 100 | 200 |
|---|
| Prec. days | 18 | 16 | 10 | 3 | 0 | 0 | 0 | 0 | 0 | 2 | 5 | 12 |
|---|
| Humidity | 82% | 82% | 78% | 72% | 67% | 61% | 58% | 57% | 60% | 64% | 69% | 77% |
|---|
| Day length | 13 | 13 | 12 | 12 | 11 | 11 | 11 | 12 | 12 | 12 | 13 | 13 |
|---|
| Sun hours | 7 | 7 | 8 | 9 | 10 | 9 | 9 | 10 | 10 | 10 | 10 | 7 |
|---|
| Sea temp | 29 | 29 | 30 | 30 | 29 | 27 | 26 | 26 | 26 | 27 | 28 | 29 |
|---|
| Morondava |
|---|
|
| Jan | Feb | Mar | Apr | May | Jun | Jul | Aug | Sep | Oct | Nov | Dec |
|---|
| Min temp. | 24 | 24 | 24 | 22 | 19 | 16 | 16 | 17 | 19 | 21 | 23 | 24 |
|---|
| Max temp. | 32 | 32 | 32 | 32 | 31 | 30 | 29 | 30 | 30 | 31 | 32 | 32 |
|---|
| Precip. | 290 | 195 | 75 | 15 | 5 | 5 | 0 | 0 | 0 | 10 | 25 | 90 |
|---|
| Prec. days | 14 | 10 | 6 | 2 | 0 | 0 | 0 | 0 | 0 | 1 | 2 | 7 |
|---|
| Humidity | 77% | 77% | 76% | 71% | 69% | 66% | 62% | 65% | 69% | 70% | 71% | 72% |
|---|
| Day length | 13 | 13 | 12 | 12 | 11 | 11 | 11 | 12 | 12 | 13 | 13 | 13 |
|---|
| Sun hours | 9 | 9 | 9 | 10 | 10 | 10 | 10 | 10 | 10 | 10 | 10 | 9 |
|---|
| Sea temp | 29 | 29 | 30 | 29 | 27 | 26 | 25 | 25 | 25 | 26 | 27 | 29 |
|---|
| Nosy Be |
|---|
|
| Jan | Feb | Mar | Apr | May | Jun | Jul | Aug | Sep | Oct | Nov | Dec |
|---|
| Min temp. | 24 | 24 | 24 | 24 | 22 | 21 | 20 | 20 | 20 | 22 | 23 | 24 |
|---|
| Max temp. | 32 | 32 | 32 | 32 | 31 | 30 | 30 | 30 | 31 | 32 | 32 | 32 |
|---|
| Precip. | 395 | 335 | 280 | 105 | 35 | 30 | 20 | 25 | 35 | 30 | 135 | 300 |
|---|
| Prec. days | 20 | 17 | 16 | 9 | 5 | 4 | 3 | 4 | 4 | 4 | 10 | 16 |
|---|
| Humidity | 81% | 81% | 79% | 75% | 72% | 70% | 67% | 64% | 62% | 61% | 66% | 76% |
|---|
| Day length | 13 | 12 | 12 | 12 | 12 | 11 | 11 | 12 | 12 | 12 | 13 | 13 |
|---|
| Sun hours | 6 | 6 | 7 | 8 | 9 | 8 | 9 | 9 | 9 | 9 | 8 | 7 |
|---|
| Sea temp | 29 | 29 | 29 | 29 | 28 | 27 | 26 | 26 | 26 | 26 | 28 | 28 |
|---|
| Toamasina |
|---|
|
| Jan | Feb | Mar | Apr | May | Jun | Jul | Aug | Sep | Oct | Nov | Dec |
|---|
| Min temp. | 23 | 23 | 23 | 22 | 20 | 19 | 17 | 17 | 18 | 19 | 21 | 22 |
|---|
| Max temp. | 31 | 31 | 30 | 30 | 28 | 26 | 25 | 26 | 26 | 28 | 29 | 30 |
|---|
| Precip. | 410 | 440 | 455 | 300 | 270 | 275 | 280 | 180 | 120 | 100 | 120 | 250 |
|---|
| Prec. days | 18 | 17 | 20 | 16 | 17 | 20 | 21 | 17 | 14 | 12 | 11 | 15 |
|---|
| Humidity | 84% | 84% | 85% | 85% | 85% | 85% | 85% | 83% | 82% | 81% | 81% | 82% |
|---|
| Day length | 13 | 13 | 12 | 12 | 11 | 11 | 11 | 12 | 12 | 12 | 13 | 13 |
|---|
| Sun hours | 7 | 7 | 6 | 7 | 6 | 5 | 5 | 6 | 7 | 8 | 8 | 7 |
|---|
| Sea temp | 28 | 29 | 28 | 28 | 27 | 26 | 25 | 24 | 24 | 25 | 26 | 28 |
|---|
| Tolanaro |
|---|
|
| Jan | Feb | Mar | Apr | May | Jun | Jul | Aug | Sep | Oct | Nov | Dec |
|---|
| Min temp. | 24 | 24 | 23 | 22 | 19 | 18 | 17 | 17 | 18 | 20 | 21 | 23 |
|---|
| Max temp. | 30 | 30 | 30 | 28 | 27 | 25 | 24 | 25 | 26 | 28 | 29 | 30 |
|---|
| Precip. | 225 | 225 | 195 | 130 | 120 | 95 | 105 | 70 | 40 | 80 | 90 | 175 |
|---|
| Prec. days | 14 | 13 | 12 | 11 | 9 | 8 | 9 | 6 | 5 | 7 | 8 | 11 |
|---|
| Humidity | 79% | 79% | 80% | 79% | 79% | 77% | 77% | 75% | 74% | 76% | 78% | 78% |
|---|
| Day length | 14 | 13 | 12 | 12 | 11 | 11 | 11 | 11 | 12 | 13 | 13 | 14 |
|---|
| Sun hours | 8 | 8 | 7 | 7 | 7 | 7 | 7 | 8 | 8 | 8 | 8 | 8 |
|---|
| Sea temp | 27 | 27 | 27 | 26 | 25 | 24 | 23 | 23 | 23 | 24 | 24 | 26 |
|---|
| Toliara |
|---|
|
| Jan | Feb | Mar | Apr | May | Jun | Jul | Aug | Sep | Oct | Nov | Dec |
|---|
| Min temp. | 24 | 24 | 23 | 21 | 18 | 16 | 15 | 16 | 17 | 20 | 22 | 23 |
|---|
| Max temp. | 33 | 33 | 33 | 32 | 30 | 28 | 28 | 28 | 30 | 31 | 32 | 32 |
|---|
| Precip. | 125 | 90 | 40 | 10 | 10 | 10 | 5 | 5 | 5 | 10 | 15 | 35 |
|---|
| Prec. days | 7 | 6 | 3 | 1 | 1 | 1 | 1 | 1 | 1 | 1 | 2 | 4 |
|---|
|
|
| Sun hours | 10 | 10 | 10 | 10 | 10 | 9 | 10 | 10 | 10 | 10 | 11 | 10 |
|---|
| Sea temp | 29 | 29 | 29 | 28 | 26 | 25 | 24 | 24 | 24 | 25 | 26 | 28 |
|---|
See also the
temperatures month by month