Select units of measurement for the temperature and rainfall tables (metric or imperial).
Average weather, temperature, rainfall, sunshine
On the islands of the Republic of Mauritius,
the climate is tropical, with a hot and rainy season which reaches its peak from January to March, and a relatively cooler and less rainy season from June to September. In fact, being that the islands are in the Southern Hemisphere, the seasons are reversed in comparison with Europe or North America. The rains, as is common in the tropics, occur primarily in the form of downpours or thunderstorms, which usually do not last long, so the sun shines for a good number of hours even in the wettest months.
The archipelago is located in the Indian Ocean, south of the equator, in the zone of the
trade winds, constant winds which in this hemisphere blow from the south-east, especially in the cool season.
The climate in detail
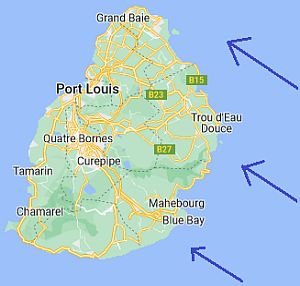
Main island
The
main island is located at a latitude of 20 degrees south, so it's not far from the Tropic of Capricorn. The island is hilly in the interior, and the highest point is
Piton de la Petite Rivière Noire, 800 meters (2,600 feet) high. In inland elevations, rainfall increases, while along the coast it rains a bit less.
 South-east trade winds in the island of Mauritius
There is also a
difference between the two sides, in fact, annual precipitation ranges from 1,200 millimeters (47 inches) on the north-west coast to 1,700 mm (67 in) on the south-east coast, which is directly affected by the trade winds. In particular, in the cool season, showers are more frequent on the east side (see Plaisance) than in the west one (see Port Louis).
The rainiest months are January, February and March, when more than 200 mm (8 in) fall per month.

In
Plaisance, where the airport is located, on the south-east coast of the main island, 1,600 mm (63 in) of rain fall per year.
On the main island, at least at sea level, the average maximum
temperature is around 29/30 °C (84/86 °F) across the island from December to March, while from June to September it drops to 25/26 °C (77/79 °F) on the southeastern side (see Plaisance), and only to around 26/27 °C (79/81 °F) in the north and west sides, which are more sheltered from the south-east trade winds.
The amount of
sunshine is not great, nor poor, which reflects the fact that the rains may be intense, but do not last long.
On the north and west sides of the island, the amount of sunshine is decent and stable, in fact, there are 7-8 hours of sunshine per day throughout the year.
On the south and east sides, instead, the least sunny period is winter, when they are directly affected by the trade winds.
The
sea temperature on the main island is high enough for swimming all year round, although it drops to 23.5/24 °C (74/75 °F) from July to October.

In addition to the main island, we find some smaller islands.
Rodrigues
 Rodrigues Island
 is located 600 kilometers (370 miles) to the north-east, and has a similar climate, a bit less cool in winter.
The climate of Rodrigues Island is also more sunny and less rainy, in fact it receives 1,100 mm (43 in) of rain per year.
The sea temperature on Rodrigues Island is practically the same as on the main island.
Further to the north, the small islands of
St. Brandon (or Cargados Carajos Shoals) are less cool from June to September, and they too receive relatively little rainfall, approximately 950 mm (37.5 in) per year.
Much further to the north, that is to say, closer to the Equator, the islands of
Agaléga are warmer throughout the year, and especially in the cool season, in fact the maximum temperature is around 29 °C (84 °F) from June to September. However, precipitation is more abundant, around 1,750 mm (69.5 in) per year, though it drops below 100 mm (4 in) per month from August to October.
Tropical cyclones
The Mauritius are in the path of
tropical cyclones, whose official season runs from November 1 to May 15, although they are more frequent from late December to mid-April.
Some particularly intense cyclones that struck the islands were Claudette in December 1979, Daniella in December 1996, Hollanda in February 1994, and Dina in February 2002.
When to go
You can visit the main island of Mauritius before and after the southern hemisphere winter, that is, in
the second half of May and in the month of October.
In the southern hemisphere
winter, from June to August, and a little less in September, the weather can get a little cool, and clouds alternate with the sun, with some brief showers. In this period, you can go hiking or you can visit the many attractions of the island (Pamplemousses, Chamarel, Grand Bassin, Île aux Cerfs etc.) with more ease. For swimming and sunbathing, given that the wind blows steadily from the southeast, it is preferable to choose a beach along the
north-west coast, on the same side as Port Louis, which is more sheltered and more sunny (but not in the northernmost tip, which is windy as well). On the contrary, surfers will appreciate exactly the wind that blows in this period.
In
December, it is hot and nature is in bloom, the air is humid and the rainy season has already begun, but the amount of sunshine is still acceptable. However, in November the cyclone season begins, and this is a threat to be reckoned with, though cyclones rarely hit a particular location.
From January to March, not only the rains are frequent, but also the air is humid, so the heat is definitely muggy.
In winter,
Rodrigues Island has a slightly better climate, in fact, it is a little less cool and rainy. It goes even better on the more northern islands of
Saint Brandon, and even more on the
Agaléga islands, which are almost equatorial.
What to pack
In
winter (June to August): bring light clothes, a sweatshirt or sweater and a light jacket for the evening, a scarf for the breeze, a raincoat. When going to the reef, you can bring snorkeling equipment, including water shoes or rubber-soled shoes.
In
summer (December to February): bring tropics-friendly, loose-fitting clothing, light shirts and pants of natural fibers (cotton, linen), a light sweatshirt for the evening, a light raincoat or umbrella for the rain showers.
Climate data - Mauritius
| Agaléga |
|---|
|
| Jan | Feb | Mar | Apr | May | Jun | Jul | Aug | Sep | Oct | Nov | Dec |
|---|
| Min temp. | 24 | 24 | 24 | 25 | 25 | 24 | 23 | 23 | 23 | 24 | 24 | 24 |
|---|
| Max temp. | 31 | 31 | 32 | 32 | 31 | 30 | 29 | 29 | 30 | 30 | 31 | 32 |
|---|
| Precip. | 275 | 255 | 195 | 175 | 120 | 105 | 100 | 60 | 55 | 95 | 110 | 225 |
|---|
| Prec. days | 17 | 16 | 15 | 14 | 12 | 12 | 14 | 11 | 9 | 10 | 11 | 14 |
|---|
| Humidity | 78% | 79% | 78% | 78% | 77% | 76% | 76% | 75% | 74% | 75% | 75% | 76% |
|---|
| Day length | 13 | 12 | 12 | 12 | 12 | 12 | 12 | 12 | 12 | 12 | 13 | 13 |
|---|
| Sun hours | 7 | 7 | 7 | 8 | 8 | 7 | 7 | 8 | 8 | 8 | 8 | 8 |
|---|
| Sea temp | 29 | 29 | 29 | 29 | 28 | 26 | 26 | 25 | 26 | 26 | 27 | 28 |
|---|
| Plaisance |
|---|
|
| Jan | Feb | Mar | Apr | May | Jun | Jul | Aug | Sep | Oct | Nov | Dec |
|---|
| Min temp. | 24 | 24 | 24 | 23 | 21 | 20 | 19 | 19 | 19 | 20 | 21 | 23 |
|---|
| Max temp. | 30 | 30 | 30 | 29 | 27 | 26 | 25 | 25 | 26 | 27 | 28 | 30 |
|---|
| Precip. | 230 | 265 | 245 | 175 | 115 | 85 | 85 | 75 | 60 | 50 | 75 | 130 |
|---|
| Prec. days | 16 | 16 | 17 | 16 | 14 | 13 | 16 | 13 | 10 | 8 | 9 | 11 |
|---|
| Humidity | 80% | 82% | 82% | 81% | 78% | 75% | 76% | 75% | 74% | 74% | 75% | 77% |
|---|
| Day length | 13 | 13 | 12 | 12 | 11 | 11 | 11 | 12 | 12 | 13 | 13 | 13 |
|---|
| Sun hours | 8 | 7 | 7 | 7 | 6 | 6 | 5 | 6 | 7 | 8 | 8 | 8 |
|---|
| Sea temp | 28 | 28 | 28 | 27 | 26 | 25 | 24 | 23 | 23 | 24 | 25 | 27 |
|---|
| Port Louis |
|---|
|
| Jan | Feb | Mar | Apr | May | Jun | Jul | Aug | Sep | Oct | Nov | Dec |
|---|
| Min temp. | 24 | 24 | 24 | 23 | 22 | 20 | 19 | 19 | 19 | 20 | 22 | 23 |
|---|
| Max temp. | 32 | 31 | 32 | 31 | 29 | 28 | 27 | 27 | 28 | 29 | 30 | 31 |
|---|
| Precip. | 130 | 160 | 85 | 85 | 50 | 25 | 20 | 20 | 15 | 15 | 25 | 85 |
|---|
| Prec. days | 9 | 10 | 8 | 7 | 6 | 4 | 4 | 5 | 3 | 3 | 3 | 6 |
|---|
|
| Day length | 13 | 13 | 12 | 12 | 11 | 11 | 11 | 12 | 12 | 13 | 13 | 13 |
|---|
| Sun hours | 8 | 8 | 7 | 8 | 8 | 7 | 7 | 7 | 8 | 9 | 9 | 9 |
|---|
| Sea temp | 28 | 28 | 28 | 27 | 26 | 25 | 24 | 23 | 23 | 24 | 25 | 27 |
|---|
| Rodrigues |
|---|
|
| Jan | Feb | Mar | Apr | May | Jun | Jul | Aug | Sep | Oct | Nov | Dec |
|---|
| Min temp. | 24 | 24 | 24 | 24 | 22 | 21 | 20 | 19 | 20 | 21 | 22 | 23 |
|---|
| Max temp. | 30 | 30 | 30 | 29 | 28 | 26 | 25 | 25 | 26 | 27 | 28 | 29 |
|---|
| Precip. | 140 | 150 | 160 | 130 | 90 | 75 | 85 | 60 | 45 | 50 | 50 | 70 |
|---|
| Prec. days | 13 | 13 | 14 | 13 | 13 | 13 | 15 | 13 | 10 | 9 | 8 | 9 |
|---|
| Humidity | 77% | 79% | 78% | 78% | 75% | 73% | 74% | 73% | 72% | 73% | 74% | 75% |
|---|
| Day length | 13 | 13 | 12 | 12 | 11 | 11 | 11 | 12 | 12 | 13 | 13 | 13 |
|---|
| Sun hours | 9 | 8 | 8 | 8 | 7 | 7 | 7 | 8 | 8 | 9 | 9 | 9 |
|---|
| Sea temp | 27 | 28 | 28 | 27 | 26 | 25 | 24 | 24 | 24 | 24 | 25 | 26 |
|---|
| St Brandon |
|---|
|
| Jan | Feb | Mar | Apr | May | Jun | Jul | Aug | Sep | Oct | Nov | Dec |
|---|
| Min temp. | 26 | 26 | 26 | 26 | 25 | 23 | 22 | 22 | 22 | 23 | 24 | 25 |
|---|
| Max temp. | 31 | 31 | 31 | 30 | 29 | 27 | 26 | 26 | 27 | 28 | 29 | 31 |
|---|
| Precip. | 140 | 185 | 140 | 125 | 70 | 45 | 50 | 45 | 30 | 25 | 35 | 80 |
|---|
| Prec. days | 11 | 12 | 12 | 11 | 9 | 10 | 11 | 11 | 7 | 6 | 5 | 8 |
|---|
| Humidity | 78% | 78% | 78% | 79% | 78% | 78% | 79% | 79% | 79% | 79% | 77% | 77% |
|---|
| Day length | 13 | 13 | 12 | 12 | 11 | 11 | 11 | 12 | 12 | 12 | 13 | 13 |
|---|
|
| Sea temp | 28 | 28 | 28 | 28 | 27 | 26 | 25 | 24 | 24 | 25 | 25 | 27 |
|---|
| Vacoas-Phoenix (425 meters) |
|---|
|
| Jan | Feb | Mar | Apr | May | Jun | Jul | Aug | Sep | Oct | Nov | Dec |
|---|
| Min temp. | 21 | 22 | 21 | 20 | 18 | 17 | 16 | 16 | 16 | 17 | 18 | 20 |
|---|
| Max temp. | 28 | 28 | 28 | 27 | 25 | 23 | 22 | 22 | 23 | 24 | 26 | 28 |
|---|
| Precip. | 315 | 340 | 290 | 175 | 125 | 100 | 120 | 95 | 75 | 60 | 80 | 165 |
|---|
| Prec. days | 17 | 18 | 18 | 16 | 13 | 15 | 18 | 16 | 13 | 10 | 9 | 12 |
|---|
|
|
| Sun hours | 7 | 7 | 7 | 7 | 7 | 7 | 7 | 7 | 7 | 8 | 8 | 8 |
|---|
|
See also the
temperatures month by month