![]() Climate chart - Lichinga (Mozambique)
Climate chart - Lichinga (Mozambique)
The climate of Lichinga (formerly Vila Cabral) is subtropical, tempered by altitude, with a warm, rainy season from November to April and a cool, dry season from June to August.
The city is located in the north of Mozambique, at 1,350 meters (4,430 feet) above sea level, and not far from Lake Malawi.
Lichinga - Climate data
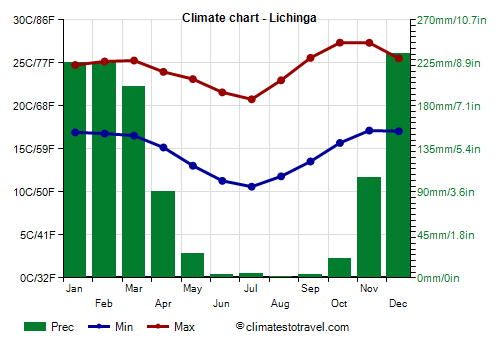
The
average temperature of the coldest month (July) is of 15.7 °C (60.2 °F), that of the warmest month (November) is of 22.2 °C (72.0 °F). Here are the average temperatures.
Lichinga - Average temperatures (1991-2020) | Month | Min (°C) | Max (°C) | Mean (°C) | Min (°F) | Max (°F) | Mean (°F) |
|---|
| January | 16.9 | 24.8 | 20.8 | 62 | 77 | 69.5 |
|---|
| February | 16.8 | 25.2 | 21 | 62 | 77 | 69.8 |
|---|
| March | 16.6 | 25.3 | 20.9 | 62 | 78 | 69.6 |
|---|
| April | 15.2 | 24 | 19.6 | 59 | 75 | 67.2 |
|---|
| May | 13 | 23.1 | 18.1 | 55 | 74 | 64.6 |
|---|
| June | 11.3 | 21.6 | 16.4 | 52 | 71 | 61.6 |
|---|
| July | 10.6 | 20.8 | 15.7 | 51 | 69 | 60.2 |
|---|
| August | 11.8 | 23 | 17.4 | 53 | 73 | 63.3 |
|---|
| September | 13.5 | 25.6 | 19.6 | 56 | 78 | 67.2 |
|---|
| October | 15.7 | 27.4 | 21.5 | 60 | 81 | 70.8 |
|---|
| November | 17.1 | 27.3 | 22.2 | 63 | 81 | 72 |
|---|
| December | 17.1 | 25.5 | 21.3 | 63 | 78 | 70.3 |
|---|
| Year | 14.6 | 24.4 | 19.5 | 58.3 | 76 | 67 |
|---|
amounts to 1135 millimeters (44.7 inches) per year: it is therefore quite abundant. It ranges from 1 mm (0 in) in the driest month (August) to 235 mm (9.3 in) in the wettest one (December). Here is the average precipitation.
Lichinga - Average precipitation| Month | Millimeters | Inches | Days |
|---|
| January | 225 | 8.9 | 19 |
|---|
| February | 225 | 8.9 | 17 |
|---|
| March | 200 | 7.9 | 18 |
|---|
| April | 90 | 3.5 | 10 |
|---|
| May | 25 | 1 | 3 |
|---|
| June | 3 | 0.1 | 1 |
|---|
| July | 4 | 0.2 | 1 |
|---|
| August | 1 | 0 | 0 |
|---|
| September | 3 | 0.1 | 1 |
|---|
| October | 20 | 0.8 | 3 |
|---|
| November | 105 | 4.1 | 9 |
|---|
| December | 235 | 9.3 | 18 |
|---|
| Year | 1135 | 44.7 | 99 |
|---|
There are on average around 2380
sunshine hours per year. Here are the average hours of sunshine per day.
Lichinga - Sunshine hours| Month | Average | Total |
|---|
January | 4 | 130 | February | 4.5 | 130 | March | 5 | 160 | April | 6 | 185 | May | 7.5 | 230 | June | 7.5 | 220 | July | 7 | 215 | August | 8 | 240 | September | 8 | 245 | October | 9 | 280 | November | 6.5 | 200 | December | 4.5 | 140 | Year | 6.5 | 2380 |
Lichinga - Weather by month
Based on the period 1991-2020
January is generally a warm month. The average temperature is of 20.8 °C (70 °F), with a minimum of 16.9 °C (62.5 °F) and a maximum of 24.8 °C (76.6 °F).

On the coldest nights of the month, the temperature usually drops to around 15 °C (59 °F). However, it dropped to 14.4 °C (57.9 °F) in January 2018.

On the warmest days of the month, the temperature usually reaches around 28.5 °C (83.5 °F). However, it reached 30.5 °C (86.9 °F) in January 2016.

Precipitation amounts to 225 mm (8.9 in), distributed over 19 days.
The day lasts on average 12 hours and 50 minutes.

There are on average 4 hours of sunshine per day. So, the sun shines 33% of the time.
The average humidity is 86%. Hence, the air is normally humid.
The average wind speed is 12 kph (7 mph).
February is generally a warm month. The average temperature is of 21.0 °C (70 °F), with a minimum of 16.8 °C (62.2 °F) and a maximum of 25.2 °C (77.3 °F).
On the coldest nights of the month, the temperature usually drops to around 15 °C (59 °F). However, it dropped to 12.8 °C (55 °F) in February 1998.
On the warmest days of the month, the temperature usually reaches around 28.5 °C (83 °F). However, it reached 32 °C (89.6 °F) in February 2020.
Precipitation amounts to 225 mm (8.9 in), distributed over 17 days.
The day lasts on average 12 hours and 30 minutes.
There are on average 4.5 hours of sunshine per day. So, the sun shines 37% of the time.
The average humidity is 84%. Hence, the air is normally humid.
The average wind speed is 13 kph (8 mph).
March is generally a warm month. The average temperature is of 20.9 °C (70 °F), with a minimum of 16.6 °C (61.8 °F) and a maximum of 25.3 °C (77.5 °F).
On the coldest nights, the temperature usually drops to around 14 °C (57 °F). However, it dropped to 10 °C (50 °F) in March 2017.
On the warmest days, the temperature usually reaches around 29 °C (84 °F). However, it reached 29.8 °C (85.6 °F) in March 1993.
Precipitation amounts to 200 mm (7.9 in), distributed over 18 days.
The day lasts on average 12 hours and 5 minutes.
There are on average 5 hours of sunshine per day. So, the sun shines 43% of the time.
The average humidity is 82%. Hence, the air is normally humid.
The average wind speed is 13 kph (8 mph).
April is generally a warm month. The average temperature is of 19.6 °C (67 °F), with a minimum of 15.2 °C (59.3 °F) and a maximum of 24 °C (75.1 °F).
On the coldest nights, the temperature usually drops to around 12 °C (54 °F). However, it dropped to 9.2 °C (48.6 °F) in April 2008.
On the warmest days, the temperature usually reaches around 27.5 °C (81.5 °F). However, it reached 30.8 °C (87.4 °F) in April 2018.
Precipitation amounts to 90 mm (3.5 in), distributed over 10 days.
The day lasts on average 11 hours and 50 minutes.
There are on average 6 hours of sunshine per day. So, the sun shines 52% of the time.
The average humidity is 79%. Hence, the air is normally humid.
The average wind speed is 17 kph (11 mph).
May is generally a warm month. The average temperature is of 18.1 °C (65 °F), with a minimum of 13 °C (55.5 °F) and a maximum of 23.1 °C (73.6 °F).
On the coldest nights, the temperature usually drops to around 10 °C (50 °F). However, it dropped to 7.4 °C (45.3 °F) in May 2010.
On the warmest days, the temperature usually reaches around 27 °C (81 °F). However, it reached 32.4 °C (90.3 °F) in May 1992.
Precipitation amounts to 25 mm (1 in), distributed over 3 days.
The day lasts on average 11 hours and 30 minutes.
There are on average 7.5 hours of sunshine per day. So, the sun shines 65% of the time.
The average humidity is 74%. Hence, the air is normally humid.
The average wind speed is 16 kph (10 mph).
June is generally a very mild month. The average temperature is of 16.4 °C (62 °F), with a minimum of 11.3 °C (52.3 °F) and a maximum of 21.6 °C (70.8 °F).
On the coldest nights, the temperature usually drops to around 7.5 °C (46 °F). However, it dropped to 6.6 °C (43.9 °F) in June 2006.
On the warmest days, the temperature usually reaches around 26 °C (79 °F). However, it reached 29 °C (84.2 °F) in June 2020.
Precipitation amounts to only 3 mm (0.1 in), and all occurs in one day.
The day lasts on average 11 hours and 25 minutes.
There are on average 7.5 hours of sunshine per day. So, the sun shines 65% of the time.
The average humidity is 69%.
The average wind speed is 16 kph (10 mph).
July, the coldest month of the year, is generally a very mild month. The average temperature is of 15.7 °C (60 °F), with a minimum of 10.6 °C (51.1 °F) and a maximum of 20.8 °C (69.4 °F).
On the coldest nights of the month, the temperature usually drops to around 7 °C (45 °F). However, it dropped to 5.1 °C (41.2 °F) in July 2012.
On the warmest days of the month, the temperature usually reaches around 25.5 °C (77.5 °F). However, it reached 26.7 °C (80.1 °F) in July 2008.
Precipitation amounts to only 4 mm (0.2 in), and all occurs in one day.
The day lasts on average 11 hours and 25 minutes.
There are on average 7 hours of sunshine per day. So, the sun shines 60% of the time.
The average humidity is 66%.
The average wind speed is 19 kph (12 mph).
August is generally a very mild month. The average temperature is of 17.4 °C (63 °F), with a minimum of 11.8 °C (53.3 °F) and a maximum of 23 °C (73.4 °F).
On the coldest nights of the month, the temperature usually drops to around 8.5 °C (47 °F). However, it dropped to 5.5 °C (41.9 °F) in August 2010.
On the warmest days of the month, the temperature usually reaches around 27.5 °C (81 °F). However, it reached 29.8 °C (85.6 °F) in August 2014.
Precipitation amounts to only 1 mm (0 in), distributed over 0 days.
The day lasts on average 11 hours and 40 minutes.
There are on average 8 hours of sunshine per day. So, the sun shines 67% of the time.
The average humidity is 62%.
The average wind speed is 18 kph (11 mph).
September is generally a warm month. The average temperature is of 19.6 °C (67 °F), with a minimum of 13.5 °C (56.4 °F) and a maximum of 25.6 °C (78.1 °F).
On the coldest nights, the temperature usually drops to around 9.5 °C (49.5 °F). However, it dropped to 7.2 °C (45 °F) in September 2006.
On the warmest days, the temperature usually reaches around 29 °C (84.5 °F). However, it reached 31 °C (87.8 °F) in September 2020.
Precipitation amounts to only 3 mm (0.1 in), and all occurs in one day.
The day lasts on average 12 hours and 0 minutes.
There are on average 8 hours of sunshine per day. So, the sun shines 68% of the time.
The average humidity is 55%.
The average wind speed is 18 kph (11 mph).
October is generally a warm month. The average temperature is of 21.5 °C (71 °F), with a minimum of 15.7 °C (60.3 °F) and a maximum of 27.4 °C (81.2 °F).
On the coldest nights, the temperature usually drops to around 12.5 °C (54.5 °F). However, it dropped to 9.5 °C (49.1 °F) in October 2018.
On the warmest days, the temperature usually reaches around 31 °C (87.5 °F). However, it reached 34.4 °C (93.9 °F) in October 2017.
Precipitation amounts to 20 mm (0.8 in), distributed over 3 days.
The day lasts on average 12 hours and 25 minutes.
There are on average 9 hours of sunshine per day. So, the sun shines 72% of the time.
The average humidity is 58%.
The average wind speed is 19 kph (12 mph).
November, the warmest month of the year, is generally a warm month. The average temperature is of 22.2 °C (72 °F), with a minimum of 17.1 °C (62.9 °F) and a maximum of 27.3 °C (81.2 °F).
On the coldest nights, the temperature usually drops to around 14.5 °C (58 °F). However, it dropped to 8.9 °C (48 °F) in November 1991.
On the warmest days, the temperature usually reaches around 31 °C (88 °F). However, it reached 34.6 °C (94.3 °F) in November 2020.
Precipitation amounts to 105 mm (4.1 in), distributed over 9 days.
The day lasts on average 12 hours and 40 minutes.
There are on average 6.5 hours of sunshine per day. So, the sun shines 53% of the time.
The average humidity is 65%.
The average wind speed is 19 kph (12 mph).
December, the warmest month of the year, is generally a warm month. The average temperature is of 21.3 °C (70 °F), with a minimum of 17.1 °C (62.7 °F) and a maximum of 25.5 °C (78 °F).
On the coldest nights of the month, the temperature usually drops to around 15 °C (59 °F). However, it dropped to 10.6 °C (51.1 °F) in December 1998.
On the warmest days of the month, the temperature usually reaches around 30 °C (85.5 °F). However, it reached 33 °C (91.4 °F) in December 2019.
Precipitation amounts to 235 mm (9.3 in), distributed over 18 days.
The day lasts on average 12 hours and 55 minutes.
There are on average 4.5 hours of sunshine per day. So, the sun shines 35% of the time.
The average humidity is 81%. Hence, the air is normally humid.
The average wind speed is 13 kph (8 mph).