Select units of measurement for the temperature and rainfall tables (metric or imperial).
Average weather, temperature, rainfall, sunshine
The climate of Norway is
oceanic, rainy but not too cold, on the west coast (see Bergen), and
semi-continental in the southeast (see Oslo). On the northern coast (see North Cape) it is
subpolar oceanic, while in inland areas it is
continental, with very cold winters and mild summers.
Precipitation (rain and snow) is abundant on the west coast, especially in the southern part, where it generally exceeds 1,200 millimeters (47 inches) per year, but in some areas even 2,500 mm (98 in). In the rest of the country, precipitation is generally moderate, between 800 and 1,000 mm (31.5 to 40 in) per year, but in Lapland, the cold northern part, it falls below 500 mm (20 in) per year.
The climate in detail
Introduction
Norway is a Nordic country, but it is affected by the
Gulf Stream, so its climate is not as cold as you might think, especially along the west coast. However, the country is
very extended in latitude, and it has a rugged coastline, as well as plateaus and mountain ranges, so there are
different climates to be taken into account.
The
sea, whose surface temperature remains a few degrees above freezing even in winter, tempers the winter weather, while it remains cool in summer, so it reduces the annual temperature range along the coast.
On the contrary, in the
interior, the influence of the sea is far less evident, and this happens also because in Norway there are almost no plains, so the mountain ranges hinder the penetration of mild currents coming from the sea.
The following map shows the climate zones in Norway.
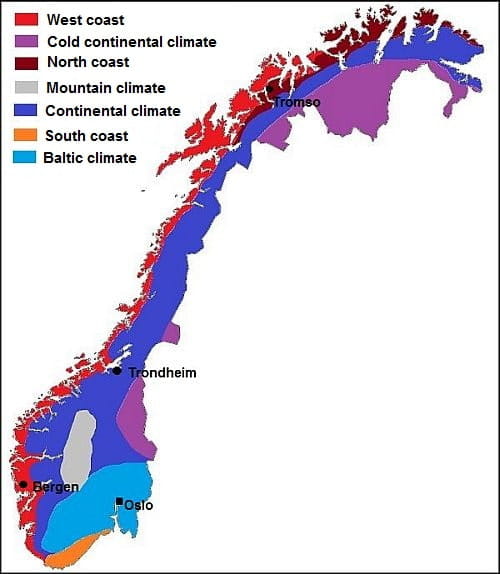 Climate zones in Norway
As is typical in Nordic countries, the climate is also marked by the
length of the days. In winter, the days are very short even in the south, and also because of the often cloudy sky, the sun is almost never seen, while in the north, there is even the polar night. In summer, however, the days are very long, and in the north, there is the midnight sun.
The west coast
The
west coast has an
oceanic climate cool and wet, often affected by weather fronts coming from the Atlantic Ocean, so much so that clouds, rain, and wind dominate throughout the year.
In the southern part of the coast,
winter is cold, also because the wind and humidity can increase the sensation of cold, however, the temperature remains, albeit slightly, above freezing (0 °C or 32 °F).
Bergen, the second largest city of the country, has an average temperature in January and February around 2.5 °C (36.5 °F). Precipitation does not always occur in the form of snow, but it often occurs in the form of a continuous and cold drizzle.
The sea, which in winter makes the air milder, during
summer cools it down, to the point that the maximum temperatures along the west coast in July and August are around 15/16 °C (59/61 °F). However, if you move a few kilometers (or miles) inland, you can experience an increase in daytime temperatures, which rises by a few degrees, and this happens in Bergen and in other towns located not directly on the ocean coast, but inside a fjord.
Precipitation is quite common along the western slope. In the southern area, it is also abundant. In Bergen, average annual precipitation is about 2,500 millimeters (98 inches), but in cities located at the foot of the hills, it can exceed 3,000 mm (118 in).
The temperature of the sea near Bergen is cold, but it's mild for the latitude, given that it fluctuates between 5.5 °C (42 °F) in March and 15 °C (59 °F) in August.

South of Bergen (see
Stavanger,
Sandnes), the sea temperature reaches 16 °C (61 °F) in August.
Moving towards the north along the coast, the winter temperature gradually decreases, but the average daily temperature reaches the freezing point only around the 65th parallel on the coast, just south of the Arctic Circle, and even more to the north on the islands.
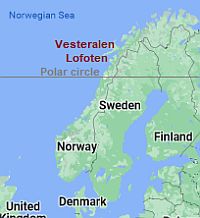 Lofoten and Vesteralen Islands, where they are located
It's remarkable that the
Lofoten and
Vesteralen Islands (see
Andenes) can sometimes experience rain instead of snow even in winter, though they are located above the Arctic Circle, and in the southernmost of the islands Lofoten (
Røst and Værøy), the average is just above freezing even in January.
Continuing to the north, the winter temperature goes down to a few degrees below freezing, and snow is frequent even along the coast, but at this point, we enter the climate area of the northern coast (as shown in the map above).
North of Bergen, precipitation is still frequent along the coast, but it is less abundant, and drops below 1,000 mm (40 in) on the coast to the north of Trondheim, although it can still reach 2,000 mm (79 in) on the slopes near the coast, where there are hills directly exposed to the westerly winds.

The
fjords of Norway, which we have already mentioned, have different microclimates depending on shape and size, and also on slope exposure, but generally, as you penetrate inland, they are less rainy throughout the year, and more continental, that is, colder in winter and warmer (and sunnier as well) in summer.
For example, the city of
Trondheim, located inside a large and deep fjord that opens into the western coast, has an average temperature ranging from -1 °C (30 °F) in January to 15.5 °C (60 °F) in July, and therefore it can be included in the continental climate zone, while in Kristiansund, on the west coast and at the same latitude, the average in January is 2 °C (35.5 °F). In Trondheim, about 845 mm (33 in) of rain or snow fall per year; the wettest seasons are summer and autumn.
The north coast
The
north coast of Norway is a bit colder than the western one, and has a subpolar oceanic climate, although a branch of the Gulf Stream arrives here as well. The result is that the open sea does not freeze even at these latitude, which does not happen anywhere else in the world.
The average winter temperatures, however, are below freezing, and tend to decrease as we move towards the east: the average in January and February goes from -1 °C to -5 °C (30 °F to 23 °F) from west to east.
At the
North Cape, the winter is longer than in Oslo, but the temperatures of the coldest months (January and February) are similar. However, the northern coast is close enough to the Pole to be reached by polar winds, which can be furious, especially in winter and spring.
In summer, July and August, which have a daily average temperature around 10.5 °C (51 °F), are the mildest and also the quietest months, with the lowest risk of wind.
At the North Cape, precipitation amounts to about 865 mm (34 in) per year. Summer is the least rainy season, although there are still 8/10 days with rainfall per month.
Near the Arctic Circle, you can see the
midnight sun around the summer solstice (21 June), and for a period much longer as you head north. At the North Cape, the sun never sets from mid-May to late July.

On the north coast too, within the
fjords there's a decrease in the winter temperatures (to the point that in the deepest fjords the sea can freeze in winter) and an increase in the summer temperatures; in fact, this phenomenon is even more pronounced here than on the west coast.
For example, in
Lakselv, located in the southern part of a fjord, more than 120 kilometers (75 miles) away from the ocean coast, the average in February is -8.5 °C (16.5 °F), while as we have seen, on the ocean coast, at the North Cape, it is just -3 °C (26.5 °F).
South-west of the North Cape, we find
Tromsø, which is not exactly on the oceanic coast but inside a small fjord. That's why the winter temperature is similar to that of the North Cape, although the city is located more to the south. In summer, however, the temperature is a bit higher (although it is still very cool).
Precipitation in Tromsø amounts to 1,020 mm (40 in) per year.
The south coast
On the
south-east coast of Norway, in the Skagerrak strait which separates the country from Denmark, the influence of the ocean is not as high as on the west coast. Therefore, this coast is not as humid and rainy as the area of Bergen, in addition, it is a bit colder in winter, when the average temperatures are around freezing, and warmer in summer, when highs are around 20/21 °C (68/70 °F). So, in this area, the weather in summer can be pleasant, and you can even hope to see a bit of sunshine.
In
Kristiansand, the average temperature ranges from 0 °C (32 °F) in January to 16.7 °C (62 °F) in July. Precipitation amounts to 1,320 mm (52 in) per year, so it is quite abundant, but it's still much lower than in Bergen.

On the southern coast (see also
Mandal), the sea temperature reaches 17 °C (63 °F) in August, and locals (and tourists from northern Europe) swim in the sea.
Inland areas
The
interior of Norway has a continental climate, with cold, snowy winters and mild summers. Typically, the interior is covered with hills and mountains, where the temperature decreases with altitude, until at high elevations, we find a mountain climate. The highest peak in Norway is Mount Galdhøpiggen, 2,469 meters (8,100 ft) high. The snowline in Norway is quite low, about 1,500 meters (5,000 feet) above sea level.
In the center-east of Norway, on the border with Sweden, ie the northern part of Hedmark and the eastern part of Sør-Trøndelag (see
Roros), the climate has very marked continental characteristics. This happens both because of the distance from the sea and because of the position on the eastern side. In addition, there is the influence of the altitude, in fact, this area is occupied by a plateau between 500 and 1,000 meters (1,600 and 3,300 feet) above sea level. Here, the temperature in winter can drop to -40 °C (-40 °F).
Lapland
The coldest area of the country is the Norwegian part of
Lapland, which corresponds to the southern part of the Finnmark County. Here, the winter is really frigid, in fact, the temperature can drop to -40 °C (-40 °F) and beyond in the worst moments.
Summer is short but intense: in the three months when the temperature rises above freezing even at night, the vegetation explodes, and the days are very long. Sometimes it can even get hot, in fact, the daytime temperature can reach 30 °C (86 °F), while nigths remain cool or even cold.
Despite the cold, in this area you can observe the
northern lights more easily than in other areas, because it is far to the north, and therefore the winter nights are very long, but the climate is drier compared to coastal areas, and therefore it is easier for the sky to be free of clouds.
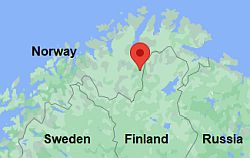 Karasjok, where is located
In
Karasjok, in Finnmark county, which is considered as the capital of Lapland, the average temperature ranges from -15 °C (5 °F) in January to 14 °C (57 °F) in July. Here, the temperature dropped to -51 °C (-60 °F) in January 1999.
In this area, precipitation is
much scarcer than in the rest of Norway, both because of the distance from the sea and because of the cold, in fact it does not reach 450 mm (17.5 in) per year. However, in summer, when temperatures rise, precipitation, which in this season occurs in the form of rain, becomes more abundant.
In Karasjok, the sun is hardly ever seen in winter (also because from December to mid-January it does not even rise), while it appears quite rarely in summer as well, despite the length of the days (it never sets from May 20 to July 25).
Baltic climate
The south-eastern part of Norway has a climate that can be defined
Baltic, that is, slightly continental, and similar to that of the coasts of Sweden overlooking the Baltic Sea.
Like other cities of Norway,
Oslo, the capital, is located in a fjord, more than 80 kilometers (50 miles) deep.
Winters are cold, with temperatures a few degrees below freezing and frequent snowfall. During winter, mild air masses from the Atlantic ocean can sometimes penetrate here as well, and rain may fall instead of snow. On other occasions, cold spells due to air masses coming from Russia are possible, so much so that the temperature can drop to around -25 °C (-13 °F).
The average temperature hovers around freezing in late November and early March.
Summer is mild or pleasantly warm, with highs around 21/23 °C (70/73 °F) in July and August.
Precipitation is moderate and well distributed throughout the year, with a maximum between summer and autumn and a minimum in spring.

The sea in the Oslo fjord reaches 17 °C (63 °F) in July and August, so it is still cold, but less than on the coasts of the Atlantic Ocean and the Norwegian Sea.
Northern islands
Finally, there are the
northern islands.
The island of
Jan Mayen, situated between the Atlantic Ocean and the Arctic Ocean, has a subarctic climate.
Further to the north, we find the
Svalbard archipelago, which is the northernmost part of Norway and is colder in winter.
Cold and heat records
The
cold records in Norway were recorded before the year 2000.
In the Nordic Islands, the cold record is -46 °C (-51 °F) in the Svalbard Islands, -30 °C (-22 °F) in the Bear Island, and -28.5 °C (-19.5 °F) in Jan Mayen.
In mainland Norway, as mentioned, the cold record is -51 °C (-60 °F) in Lapland, while it is -47.5 °C (-53.5 °F) in Roros, in the cold part of the center, -35 °C (-31 °F) north of Oslo, -26 °C (-15 °F) in Trondheim and Oslo, -25 °C (-13 °F) on the Skagerrak coast to the south (see Mandal, Kristiansand), -16 °C (3 °F) in Bergen, and only -10 °C (14 °F) in Røstlandet, in southern Lofoten.
On the coasts, the
heat record is 26 °C (79 °F) in the North Cape, 23 °C (73.5 °F) in the most exposed islands (see Røstlandet), 29/30 °C (84/86 °F) on the coastal cities that are located inside a fjord, also in the north (see Ålesund, Tromsø), 34 °C (93 °F) in the inland areas of the center and south (see Trondheim and Oslo). In the Nordic Islands, the highest recorded temperature is 17 °C (62.5 °F) in Jan Mayen and 21.7 °C (71 °F) in Svalbard.
In July 2019, in Saltdal, in a valley 60 km (37 mi) away from the sea, it reached 34.6 °C (94.3 °F), which is the highest temperature in Norway north of the Polar circle. On the other hand, in the south, in Nesbyen, in a valley north-west of Oslo, the temperature reached 35.6 °C (96 °F) in June 1970, which is the highest temperature ever in the whole of Norway.
When to go
The best time to go to Norway is the
summer, from June to August. Temperatures are very cool along the coasts and in mountainous areas, and even cold along the northern coast. In inland areas, in Oslo and along the southern coast, temperatures are generally mild, but a sweater for the evening is still advisable. Sometimes, it can even be a bit hot during the day, while nights remain cool.
In Lapland, temperatures are a bit more variable, so it can get hot during the day, but also cold at night.
In Norway, there is a fair amount of rainy days even in summer, especially along the western coast.
June is a bit cooler than July and August, but it is (relatively) drier and sunnier, and has longer days, with the white nights in the south and the midnight sun in the north.
On the northern islands, temperatures are definitely low even in summer, but at least they are above freezing, albeit slightly.
As we mentioned, the
sea, which has a surface temperature of 5/6 °C (41/43 °F) in winter, remains cool in summer, and reaches 15 °C (59 °F) in August at Bergen, and only 11 °C (52 °F) at Tromsø: with these temperatures, it takes a lot of courage to swim in the sea!
It goes a bit better in the Skagerrak Strait and near Oslo, where the water temperature reaches 17 °C (63 °F) in July and August.
For a
ski holiday, the month of March can be recommended, since the temperature is higher and the days are longer than in midwinter.
To observe the
northern lights, on the other hand, you need the darkness, so the best period goes from November to January.
What to pack
In
winter: for Oslo and the inland and northern areas, bring very warm clothes, synthetic, thermal long underwear, a fleece, a down jacket, a hat, gloves, a scarf. For the west coast, bring a sweater, a down jacket, a hat, a raincoat or umbrella.
In
summer: bring spring/autumn clothes, being ready to add or remove the outer layer, a T-shirt, but also long pants, a sweatshirt or sweater; a jacket, a raincoat or umbrella.
It can be a useful to bring a windbreaker and a raincoat for the wind and the rain, especially along the coast and for a ferry trip in the fjords.
For the northern islands (Jan Mayen, Svalbard): bring warm clothing, a down jacket, a hat, gloves, a windbreaker, a raincoat.
Climate data - Norway
| Bergen |
|---|
|
| Jan | Feb | Mar | Apr | May | Jun | Jul | Aug | Sep | Oct | Nov | Dec |
|---|
| Min temp. | 1 | 0 | 1 | 4 | 7 | 10 | 12 | 12 | 10 | 6 | 3 | 1 |
|---|
| Max temp. | 5 | 5 | 7 | 11 | 15 | 18 | 20 | 19 | 16 | 12 | 8 | 5 |
|---|
| Precip. | 255 | 210 | 200 | 140 | 110 | 135 | 155 | 210 | 245 | 270 | 270 | 290 |
|---|
| Prec. days | 19 | 17 | 18 | 14 | 13 | 13 | 15 | 17 | 16 | 18 | 18 | 19 |
|---|
| Humidity | 82% | 80% | 78% | 74% | 73% | 77% | 80% | 81% | 81% | 81% | 81% | 83% |
|---|
| Day length | 7 | 9 | 12 | 15 | 17 | 19 | 18 | 16 | 13 | 10 | 7 | 6 |
|---|
| Sun hours | 0 | 2 | 3 | 4 | 7 | 5 | 5 | 5 | 3 | 2 | 1 | 0 |
|---|
| Sea temp | 7 | 6 | 6 | 6 | 8 | 12 | 14 | 15 | 14 | 12 | 10 | 8 |
|---|
| Karasjok |
|---|
|
| Jan | Feb | Mar | Apr | May | Jun | Jul | Aug | Sep | Oct | Nov | Dec |
|---|
| Min temp. | -20 | -20 | -14 | -7 | 0 | 6 | 9 | 7 | 2 | -4 | -13 | -18 |
|---|
| Max temp. | -9 | -8 | -2 | 3 | 9 | 15 | 19 | 16 | 11 | 2 | -4 | -7 |
|---|
| Precip. | 25 | 20 | 20 | 20 | 30 | 55 | 65 | 60 | 40 | 35 | 25 | 25 |
|---|
| Prec. days | 8 | 7 | 7 | 6 | 7 | 9 | 11 | 10 | 9 | 8 | 7 | 8 |
|---|
| Humidity | 85% | 84% | 82% | 76% | 71% | 68% | 72% | 79% | 84% | 87% | 89% | 86% |
|---|
| Day length | 2 | 8 | 12 | 16 | 22 | 24 | 24 | 18 | 13 | 10 | 4 | 0 |
|---|
| Sun hours | 0 | 1 | 4 | 6 | 6 | 6 | 6 | 4 | 3 | 1 | 0 | 0 |
|---|
|
| Kristiansand |
|---|
|
| Jan | Feb | Mar | Apr | May | Jun | Jul | Aug | Sep | Oct | Nov | Dec |
|---|
| Min temp. | -3 | -3 | -1 | 2 | 6 | 10 | 12 | 12 | 9 | 5 | 1 | -2 |
|---|
| Max temp. | 3 | 4 | 6 | 10 | 15 | 19 | 21 | 20 | 16 | 11 | 7 | 4 |
|---|
| Precip. | 140 | 90 | 80 | 65 | 75 | 85 | 85 | 125 | 135 | 170 | 150 | 130 |
|---|
| Prec. days | 14 | 11 | 10 | 9 | 9 | 9 | 8 | 11 | 12 | 14 | 14 | 13 |
|---|
| Humidity | 84% | 81% | 75% | 70% | 67% | 67% | 70% | 74% | 78% | 81% | 84% | 85% |
|---|
| Day length | 7 | 9 | 12 | 14 | 17 | 18 | 17 | 15 | 13 | 10 | 8 | 6 |
|---|
| Sun hours | 2 | 3 | 4 | 6 | 8 | 9 | 8 | 7 | 5 | 3 | 2 | 1 |
|---|
| Sea temp | 6 | 5 | 5 | 6 | 10 | 13 | 16 | 17 | 15 | 12 | 10 | 8 |
|---|
| North Cape (300 meters) |
|---|
|
| Jan | Feb | Mar | Apr | May | Jun | Jul | Aug | Sep | Oct | Nov | Dec |
|---|
| Min temp. | -5 | -5 | -3 | -1 | 2 | 5 | 8 | 9 | 6 | 2 | -1 | -3 |
|---|
| Max temp. | 0 | -1 | 0 | 3 | 6 | 9 | 13 | 13 | 10 | 5 | 2 | 1 |
|---|
| Precip. | 125 | 105 | 75 | 65 | 40 | 35 | 45 | 55 | 55 | 95 | 70 | 95 |
|---|
| Prec. days | 21 | 18 | 16 | 13 | 11 | 8 | 9 | 10 | 12 | 18 | 14 | 20 |
|---|
|
| Day length | 1 | 7 | 12 | 17 | 23 | 24 | 24 | 19 | 13 | 9 | 2 | 0 |
|---|
|
| Sea temp | 5 | 4 | 4 | 4 | 5 | 7 | 9 | 10 | 9 | 7 | 6 | 6 |
|---|
| Oslo |
|---|
|
| Jan | Feb | Mar | Apr | May | Jun | Jul | Aug | Sep | Oct | Nov | Dec |
|---|
| Min temp. | -5 | -5 | -2 | 2 | 7 | 11 | 13 | 13 | 9 | 4 | 0 | -4 |
|---|
| Max temp. | 0 | 1 | 5 | 11 | 17 | 20 | 23 | 21 | 16 | 10 | 4 | 1 |
|---|
| Precip. | 60 | 45 | 40 | 50 | 60 | 80 | 85 | 105 | 80 | 90 | 85 | 50 |
|---|
| Prec. days | 10 | 8 | 7 | 8 | 9 | 10 | 11 | 11 | 9 | 10 | 11 | 10 |
|---|
| Humidity | 87% | 84% | 74% | 66% | 63% | 65% | 69% | 75% | 78% | 83% | 88% | 89% |
|---|
| Day length | 7 | 9 | 12 | 15 | 17 | 19 | 18 | 16 | 13 | 10 | 8 | 6 |
|---|
| Sun hours | 2 | 3 | 5 | 6 | 8 | 8 | 8 | 7 | 5 | 3 | 2 | 1 |
|---|
| Sea temp | 5 | 4 | 4 | 6 | 10 | 14 | 17 | 18 | 15 | 12 | 9 | 6 |
|---|
| Tromso |
|---|
|
| Jan | Feb | Mar | Apr | May | Jun | Jul | Aug | Sep | Oct | Nov | Dec |
|---|
| Min temp. | -5 | -6 | -4 | -2 | 3 | 7 | 9 | 8 | 5 | 1 | -2 | -4 |
|---|
| Max temp. | 0 | -1 | 1 | 4 | 9 | 12 | 16 | 15 | 11 | 5 | 2 | 1 |
|---|
| Precip. | 105 | 95 | 90 | 60 | 55 | 55 | 60 | 75 | 100 | 125 | 95 | 110 |
|---|
| Prec. days | 15 | 13 | 14 | 12 | 11 | 10 | 10 | 11 | 14 | 16 | 13 | 15 |
|---|
| Humidity | 80% | 79% | 76% | 74% | 71% | 74% | 79% | 81% | 82% | 82% | 80% | 80% |
|---|
| Day length | 2 | 7 | 12 | 16 | 22 | 24 | 24 | 18 | 13 | 9 | 4 | 0 |
|---|
| Sun hours | 0 | 1 | 4 | 5 | 7 | 7 | 7 | 5 | 3 | 2 | 0 | 0 |
|---|
| Sea temp | 5 | 5 | 5 | 5 | 6 | 8 | 10 | 11 | 10 | 8 | 7 | 6 |
|---|
| Trondheim |
|---|
|
| Jan | Feb | Mar | Apr | May | Jun | Jul | Aug | Sep | Oct | Nov | Dec |
|---|
| Min temp. | -4 | -4 | -2 | 1 | 5 | 9 | 11 | 11 | 8 | 3 | -1 | -4 |
|---|
| Max temp. | 2 | 2 | 5 | 9 | 14 | 17 | 20 | 19 | 15 | 9 | 5 | 2 |
|---|
| Precip. | 65 | 65 | 65 | 40 | 55 | 80 | 75 | 85 | 90 | 80 | 65 | 80 |
|---|
| Prec. days | 12 | 12 | 13 | 10 | 11 | 13 | 11 | 13 | 13 | 13 | 11 | 14 |
|---|
| Humidity | 75% | 74% | 70% | 67% | 68% | 71% | 74% | 75% | 76% | 78% | 78% | 78% |
|---|
| Day length | 6 | 9 | 12 | 15 | 18 | 20 | 19 | 16 | 13 | 10 | 7 | 5 |
|---|
| Sun hours | 0 | 2 | 3 | 5 | 6 | 6 | 6 | 5 | 4 | 3 | 1 | 0 |
|---|
| Sea temp | 7 | 6 | 6 | 6 | 8 | 10 | 13 | 14 | 12 | 10 | 9 | 7 |
|---|
See also the
temperatures month by month