Select units of measurement for the temperature and rainfall tables (metric or imperial).
Average weather, temperature, rainfall, sunshine
In Croatia, an Eastern European country overlooking the Adriatic Sea, there are
three types of climate:
- the
Mediterranean climate of Istria, the coast and the islands, mild (especially in the southern part) and rainy in winter;
- the climate of the
Dinaric Alps, cold and snowy in winter and cool in summer, with thunderstorms in the afternoon;
- the
continental climate of the interior plains.
Croatia is moderately
rainy in the plains and inland valleys, and definitely rainy along the coast and the western slopes of the mountain ranges. The rainfall pattern is Mediterranean along the coast, with a minimum in summer and a maximum in autumn and winter, while in the interior plains, precipitation is frequent throughout the year, and in winter, it often occurs in the form of snow, but it's more abundant in summer, when it often occurs in the form of thunderstorms.
Index
Adriatic coast
On the
Adriatic coast, the climate is
Mediterranean, but in the northern part, where winter is quite cold and summer remains quite rainy, it can be described as transitional Mediterranean.
In autumn and winter, the sirocco brings rainfall, while in summer, a north-westerly breeze, called mistral, blows.
Rainfall is quite abundant on the entire Adriatic coast, but especially in the cities located at the foot of the mountains (see
Rijeka), where between 1,000 and 1,500 millimeters (40 and 60 inches) of rain fall per year. Otherwise, on the west coast of Istria (see
Rovinj) and on the islands, rainfall amounts to 800/1,000 mm (31/40 in) per year.
Summer is sunny throughout the coastal strip, with occasional rains or thunderstorms, most likely in the north, in Istria; only in the northernmost zone, where Rijeka is located, the rains are quite frequent and abundant even in July and August.
Istria
The northern coast, in Istria (see
Pula, Pola in Italian) and in cities such as Rijeka (Fiume), has fairly mild winters, with an average in January around 5/6 °C (41/43 °F), but with sudden drops in temperature when the
Bora blows, a violent wind coming from the freezing Russian plains. However, snowfalls are rare and not abundant because continental air is dry. In these cases, the temperature can drop as low as -10 °C (14 °F).
Summers are warm and sunny, sometimes hot, though the breeze tempers the heat. Sometimes, there can be cool days, with rains and a bit of Bora, even in summer. There can also be hot and sultry periods, with highs of 35 °C (95 °F) and more.
Pula
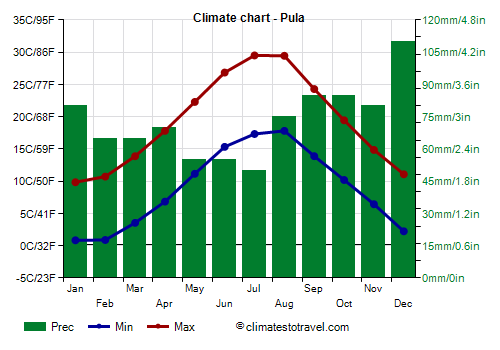
In
Pula, the average temperature ranges from 5.5 °C (42 °F) in January to 23.5 °C (74.5 °F) in July and August. On average, 870 mm (34 in) of rain fall per year.
In Pula and in the Northern Adriatic, the sun does not shine very often in winter, while in summer, it frequently shines (though less than in the southern part).
The temperature of the sea is warm enough for swimming in summer, especially in July and August, but also in September.
Dalmatia
In Dalmatia, the Croatian coastal region to the south of Istria, the climate becomes progressively milder.
In the northernmost islands (see Cres, Krk, Rab), winter is still quite cold, while in the central part (see
Losinj, Pag, and on the coast where
Zadar,
Sibenik and Split are found), the average in January rises to around 8 °C (46 °F).
In winter, however, outbreaks of cold air are possible here as well, with a wind similar to the Bora (though somewhat milder), especially at the mouth of the valleys, where the air is channeled between the mountains. In these cases, the temperature can drop as low as -6/-7 °C (19/21 °F).
Compared to Istria, summer in Dalmatia is a bit warmer and sunnier. Very hot and muggy periods are more frequent and of longer duration, especially in the cities (and a little less on the islands).
Split
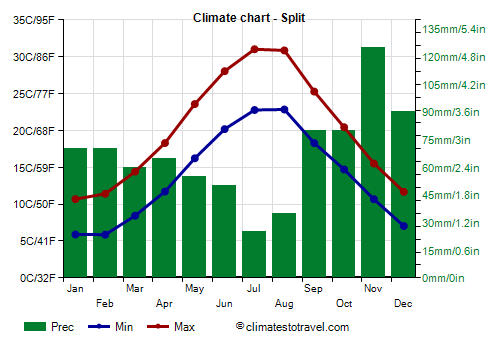
In
Split (Spalato), the daily average temperature ranges from 8.3 °C (47 °F) in January to 27 °C (80.5 °F) in July.
In Split, 800 mm (31.5 in) of rain fall per year, with a Mediterranean pattern, so with a summer minimum.
The amount of sunshine is slightly higher than in the northern part of the coast, and it is very good in summer.
In Split, the sea temperature is a bit warmer in winter compared to the norther part, while it is quite the same in summer.
In the southern part of the coast, south of Split, in the islands of Brac,
Hvar, Vis, Korcula and Mljet, and in the city of
Dubrovnik (Ragusa), the January average reaches 10/11 °C (50/52 °F).
Dubrovnik
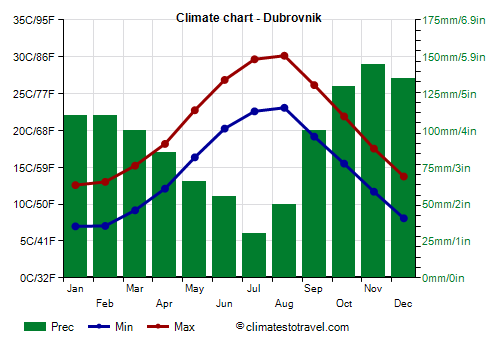
In
Dubrovnik, located in the southernmost part of the coast, the winter is even milder, in fact the average in January and February is around 10 °C (50 °F).
The southern part of the Dalmatian coast, as well as being milder, is also more rainy. In Dubrovnik, 1,100 mm (43 in) of rain fall per year.
In Dubrovnik and in the southern part of the coast, the sea temperature is practically the same as in Split.
Dinaric Alps
The Dinaric Alps separate the Mediterranean world from the interior plains. The highest peak in Croatia, which also gives its name to the mountain range, is Dinara (1,831 meters or 6,007 feet), on the border with Bosnia.
In the area of the Dinaric Alps, the climate is more
continental, but is very rainy (and snowy in winter) because of the proximity to the sea, especially on the slopes exposed to the west and south. In fact, in the most humid areas, precipitation can even reach 3,000 mm (120 in) per year.
Gospic
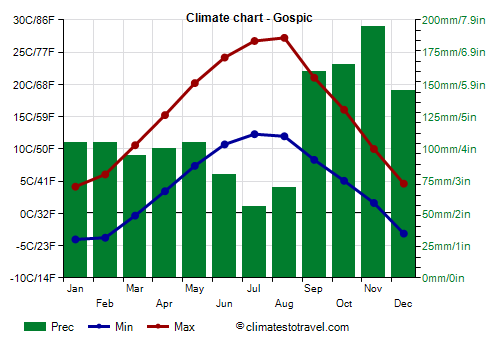
In
Gospic, located less than 20 kilometers (12 miles) away from the coast, and 550 meters (1,800 ft) above sea level, the average temperature in January is 0 °C (32 °F), while in July and August it's 19.5 °C (67 °F).
During winter, cold waves can occur, with noticeable peaks (even -30 °C or -22 °F). In spring, pleasant days alternate with the return of cold weather, with possible snowfalls even in April. During summer, some afternoon thunderstorms are possible, and nights remain cool, but sometimes, the days can be hot.
In Gospic, precipitation is abundant, amounting to 1,400 mm (55 in) per year.
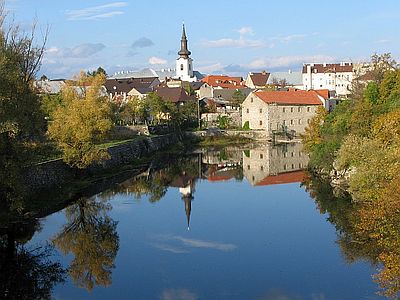
The Plitvice Lakes National Park is located in this area, about 550/600 meters (1,800/2,000 feet) above sea level.
Zavizan
At higher altitudes, winter is freezing and summer is cool. At the
Zavizan mountain hut, at 1,600 meters (5,250 feet), in the northern Velebit national park, the average temperature ranges from -3 °C (26.5 °F) in January to 14 °C (57 °F) in July.
Precipitation is even more abundant, and is close to 2,000 mm (78 in) per year.
Northern plains
In the northern and eastern plains, the climate is
continental, with cold winters and hot summers, and with a rainfall pattern different from that of the Mediterranean: summer is the rainiest season, mainly because of thunderstorms occurring in the afternoon, while in winter, although precipitation is frequent, it is not abundant.
The western part (see Zagreb,
Varazdin), where precipitation exceeds 850 mm (33.5 in) per year, is rainier than the eastern one, where it drops to 750 mm (29.5 in) per year (see
Slavonski Brod). In the extreme east, on the border with Serbia, in cities like
Osijek and Vukovar, where the autumn rains are poorer, annual precipitation drops to around 700 mm (27.5 in).
Winter is cold, cold drizzle or snow often falls, days can be dull and foggy, but sometimes, cold air masses from Russia can lower the temperature to about -20 °C (-4 °F). Summer is warm or even hot, with pleasant days alternating with hot and sultry days, with some chance of thunderstorms in the afternoon. Sometimes there may be heat waves, with highs of 37/38 °C (99/100 °F).
Zagreb
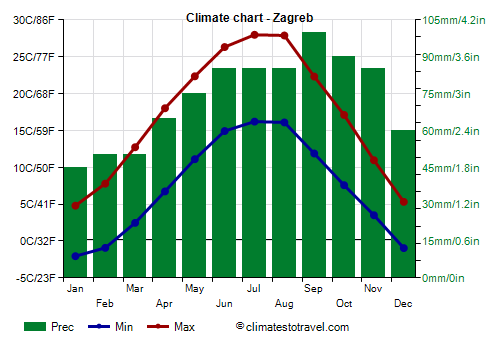
In
Zagreb, the capital, the monthly average temperature ranges from 1.5 °C (34.5 °F) in January to 22 °C (72 °F) in July.
The sun in Zagreb is rarely seen in winter, while it shines quite often in summer, though not as often as along the coast.
Precipitation is still quite abundant, about 885 mm (35 in) per year, with a minimum in winter and a maximum between summer and autumn.
When to go
For a
beach holiday, the best months are
July and August. It is worth while to recall that the northernmost part of the coast (Istria, Rijeka) can sometimes experience thunderstorms, or rainy days even in summer, which are rarer along the coast of Dalmatia.
In general, autumn rains (which can be heavy in the coastal area) begin in the middle of September. In autumn, the moist southerly winds prevail.
You can visit the rest of Croatia (inland regions, including the capital) from
May to September. The sun often shines, but during the afternoon, thunderstorms are possible (on average, one day every 3 or 4).
In July and August, it can be hot at times, especially in the plains and in inland valleys, so those who don't like the heat may prefer May, June and September.
What to pack
In
winter: in inland areas, bring warm clothes, a hat, a down jacket, a scarf, gloves, and a raincoat or umbrella. On the coast: bring warm clothes, a coat, and a raincoat or umbrella; a hat, a scarf, and gloves for the days with the Bora.
In
summer: bring light clothes, T-shirts, but also long pants, a light jacket and a sweatshirt for the evening and for cooler days, especially in inland areas and in Istria; an umbrella or raincoat, especially in inland areas and Istria.
Climate data - Croatia
| Dubrovnik |
|---|
|
| Jan | Feb | Mar | Apr | May | Jun | Jul | Aug | Sep | Oct | Nov | Dec |
|---|
| Min temp. | 7 | 7 | 9 | 12 | 16 | 20 | 23 | 23 | 19 | 16 | 12 | 8 |
|---|
| Max temp. | 13 | 13 | 15 | 18 | 23 | 27 | 30 | 30 | 26 | 22 | 18 | 14 |
|---|
| Precip. | 110 | 110 | 100 | 85 | 65 | 55 | 30 | 50 | 100 | 130 | 145 | 135 |
|---|
| Prec. days | 9 | 9 | 8 | 8 | 6 | 4 | 3 | 3 | 6 | 8 | 10 | 10 |
|---|
| Humidity | 63% | 61% | 61% | 62% | 62% | 58% | 52% | 54% | 59% | 66% | 68% | 63% |
|---|
| Day length | 10 | 11 | 12 | 13 | 15 | 15 | 15 | 14 | 12 | 11 | 10 | 9 |
|---|
| Sun hours | 4 | 5 | 6 | 7 | 9 | 10 | 11 | 11 | 8 | 6 | 4 | 4 |
|---|
| Sea temp | 14 | 14 | 14 | 15 | 18 | 22 | 24 | 25 | 23 | 20 | 18 | 16 |
|---|
| Gospic (550 meters) |
|---|
|
| Jan | Feb | Mar | Apr | May | Jun | Jul | Aug | Sep | Oct | Nov | Dec |
|---|
| Min temp. | -4 | -4 | 0 | 3 | 7 | 11 | 12 | 12 | 8 | 5 | 2 | -3 |
|---|
| Max temp. | 4 | 6 | 11 | 15 | 20 | 24 | 27 | 27 | 21 | 16 | 10 | 5 |
|---|
| Precip. | 105 | 105 | 95 | 100 | 105 | 80 | 55 | 70 | 160 | 165 | 195 | 145 |
|---|
| Prec. days | 10 | 9 | 9 | 10 | 10 | 8 | 6 | 6 | 9 | 10 | 12 | 11 |
|---|
| Humidity | 84% | 81% | 76% | 73% | 73% | 74% | 71% | 74% | 78% | 81% | 83% | 86% |
|---|
| Day length | 9 | 10 | 12 | 14 | 15 | 16 | 15 | 14 | 12 | 11 | 10 | 9 |
|---|
| Sun hours | 2 | 4 | 5 | 6 | 8 | 9 | 10 | 10 | 6 | 4 | 2 | 2 |
|---|
|
| Hvar |
|---|
|
| Jan | Feb | Mar | Apr | May | Jun | Jul | Aug | Sep | Oct | Nov | Dec |
|---|
| Min temp. | 6 | 6 | 8 | 11 | 16 | 20 | 22 | 22 | 18 | 15 | 12 | 8 |
|---|
| Max temp. | 13 | 13 | 16 | 19 | 23 | 28 | 31 | 31 | 27 | 22 | 18 | 14 |
|---|
| Precip. | 60 | 65 | 60 | 60 | 45 | 40 | 25 | 40 | 70 | 85 | 110 | 95 |
|---|
| Prec. days | 8 | 8 | 7 | 7 | 6 | 4 | 2 | 3 | 5 | 6 | 9 | 9 |
|---|
| Humidity | 67% | 65% | 63% | 65% | 63% | 61% | 56% | 59% | 61% | 66% | 68% | 66% |
|---|
| Day length | 9 | 11 | 12 | 14 | 15 | 15 | 15 | 14 | 12 | 11 | 10 | 9 |
|---|
| Sun hours | 4 | 6 | 6 | 8 | 10 | 11 | 12 | 11 | 8 | 6 | 4 | 4 |
|---|
| Sea temp | 14 | 14 | 14 | 15 | 18 | 22 | 25 | 25 | 23 | 20 | 17 | 16 |
|---|
| Losinj |
|---|
|
| Jan | Feb | Mar | Apr | May | Jun | Jul | Aug | Sep | Oct | Nov | Dec |
|---|
| Min temp. | 7 | 6 | 9 | 14 | 18 | 22 | 25 | 24 | 20 | 15 | 12 | 8 |
|---|
| Max temp. | 10 | 10 | 13 | 17 | 22 | 26 | 29 | 28 | 24 | 19 | 15 | 11 |
|---|
| Precip. | 75 | 70 | 65 | 70 | 60 | 70 | 30 | 55 | 105 | 110 | 125 | 95 |
|---|
| Prec. days | 8 | 7 | 7 | 8 | 7 | 6 | 4 | 5 | 7 | 8 | 10 | 8 |
|---|
| Humidity | 71% | 66% | 66% | 64% | 62% | 58% | 50% | 56% | 60% | 68% | 70% | 70% |
|---|
| Day length | 9 | 10 | 12 | 14 | 15 | 16 | 15 | 14 | 12 | 11 | 10 | 9 |
|---|
| Sun hours | 4 | 5 | 6 | 7 | 9 | 10 | 12 | 10 | 8 | 6 | 4 | 3 |
|---|
| Sea temp | 13 | 12 | 12 | 14 | 18 | 22 | 25 | 25 | 23 | 20 | 17 | 15 |
|---|
| Osijek |
|---|
|
| Jan | Feb | Mar | Apr | May | Jun | Jul | Aug | Sep | Oct | Nov | Dec |
|---|
| Min temp. | -3 | -2 | 2 | 6 | 11 | 14 | 16 | 15 | 11 | 7 | 3 | -1 |
|---|
| Max temp. | 4 | 7 | 13 | 18 | 23 | 27 | 29 | 29 | 23 | 18 | 11 | 5 |
|---|
| Precip. | 45 | 40 | 45 | 50 | 70 | 80 | 65 | 65 | 65 | 60 | 55 | 55 |
|---|
| Prec. days | 7 | 8 | 7 | 8 | 9 | 9 | 7 | 6 | 7 | 7 | 8 | 8 |
|---|
| Humidity | 88% | 84% | 77% | 72% | 72% | 73% | 71% | 73% | 77% | 79% | 87% | 89% |
|---|
| Day length | 9 | 10 | 12 | 14 | 15 | 16 | 15 | 14 | 12 | 11 | 10 | 9 |
|---|
| Sun hours | 2 | 3 | 5 | 6 | 8 | 9 | 9 | 9 | 6 | 5 | 3 | 2 |
|---|
|
| Pula |
|---|
|
| Jan | Feb | Mar | Apr | May | Jun | Jul | Aug | Sep | Oct | Nov | Dec |
|---|
| Min temp. | 1 | 1 | 4 | 7 | 11 | 15 | 17 | 18 | 14 | 10 | 6 | 2 |
|---|
| Max temp. | 10 | 11 | 14 | 18 | 22 | 27 | 30 | 29 | 24 | 19 | 15 | 11 |
|---|
| Precip. | 80 | 65 | 65 | 70 | 55 | 55 | 50 | 75 | 85 | 85 | 80 | 110 |
|---|
| Prec. days | 8 | 7 | 7 | 8 | 7 | 6 | 4 | 5 | 7 | 8 | 10 | 8 |
|---|
| Humidity | 76% | 71% | 67% | 68% | 68% | 64% | 59% | 61% | 69% | 77% | 79% | 77% |
|---|
| Day length | 9 | 10 | 12 | 14 | 15 | 16 | 15 | 14 | 12 | 11 | 10 | 9 |
|---|
| Sun hours | 3 | 4 | 5 | 6 | 8 | 9 | 10 | 9 | 7 | 5 | 3 | 3 |
|---|
| Sea temp | 12 | 11 | 12 | 14 | 18 | 22 | 25 | 26 | 23 | 20 | 17 | 14 |
|---|
| Rijeka |
|---|
|
| Jan | Feb | Mar | Apr | May | Jun | Jul | Aug | Sep | Oct | Nov | Dec |
|---|
| Min temp. | 3 | 3 | 6 | 9 | 14 | 17 | 20 | 20 | 15 | 12 | 8 | 4 |
|---|
| Max temp. | 10 | 10 | 14 | 18 | 23 | 27 | 30 | 30 | 24 | 19 | 14 | 11 |
|---|
| Precip. | 125 | 135 | 110 | 105 | 110 | 85 | 65 | 95 | 185 | 205 | 210 | 165 |
|---|
| Prec. days | 8 | 7 | 7 | 9 | 8 | 8 | 6 | 7 | 9 | 10 | 11 | 9 |
|---|
| Humidity | 64% | 59% | 56% | 56% | 56% | 53% | 49% | 50% | 58% | 64% | 66% | 66% |
|---|
| Day length | 9 | 10 | 12 | 14 | 15 | 16 | 15 | 14 | 12 | 11 | 10 | 9 |
|---|
| Sun hours | 4 | 5 | 5 | 6 | 8 | 9 | 10 | 10 | 7 | 5 | 3 | 4 |
|---|
| Sea temp | 12 | 11 | 11 | 14 | 18 | 22 | 25 | 25 | 23 | 20 | 17 | 14 |
|---|
| Split |
|---|
|
| Jan | Feb | Mar | Apr | May | Jun | Jul | Aug | Sep | Oct | Nov | Dec |
|---|
| Min temp. | 6 | 6 | 8 | 12 | 16 | 20 | 23 | 23 | 18 | 15 | 11 | 7 |
|---|
| Max temp. | 11 | 11 | 14 | 18 | 24 | 28 | 31 | 31 | 25 | 20 | 16 | 12 |
|---|
| Precip. | 70 | 70 | 60 | 65 | 55 | 50 | 25 | 35 | 80 | 80 | 125 | 90 |
|---|
| Prec. days | 8 | 8 | 7 | 8 | 6 | 5 | 3 | 3 | 6 | 7 | 10 | 9 |
|---|
| Humidity | 64% | 61% | 59% | 60% | 59% | 55% | 48% | 50% | 58% | 66% | 69% | 65% |
|---|
| Day length | 9 | 10 | 12 | 14 | 15 | 15 | 15 | 14 | 12 | 11 | 10 | 9 |
|---|
| Sun hours | 4 | 5 | 6 | 7 | 9 | 11 | 12 | 11 | 8 | 6 | 4 | 4 |
|---|
| Sea temp | 14 | 14 | 14 | 15 | 18 | 22 | 25 | 25 | 23 | 20 | 17 | 16 |
|---|
| Varazdin |
|---|
|
| Jan | Feb | Mar | Apr | May | Jun | Jul | Aug | Sep | Oct | Nov | Dec |
|---|
| Min temp. | -3 | -2 | 2 | 6 | 10 | 14 | 15 | 15 | 11 | 7 | 3 | -2 |
|---|
| Max temp. | 4 | 7 | 12 | 17 | 22 | 26 | 27 | 27 | 22 | 17 | 10 | 5 |
|---|
| Precip. | 40 | 50 | 50 | 60 | 75 | 85 | 90 | 85 | 105 | 85 | 75 | 55 |
|---|
| Prec. days | 6 | 6 | 6 | 8 | 10 | 9 | 9 | 8 | 9 | 7 | 8 | 7 |
|---|
| Humidity | 82% | 75% | 68% | 64% | 66% | 66% | 66% | 68% | 75% | 79% | 83% | 85% |
|---|
| Day length | 9 | 10 | 12 | 14 | 15 | 16 | 15 | 14 | 12 | 11 | 9 | 9 |
|---|
| Sun hours | 3 | 4 | 5 | 7 | 8 | 9 | 10 | 9 | 6 | 5 | 3 | 2 |
|---|
|
| Zadar |
|---|
|
| Jan | Feb | Mar | Apr | May | Jun | Jul | Aug | Sep | Oct | Nov | Dec |
|---|
| Min temp. | 5 | 5 | 7 | 10 | 15 | 19 | 21 | 21 | 17 | 13 | 10 | 6 |
|---|
| Max temp. | 11 | 11 | 14 | 18 | 22 | 27 | 29 | 29 | 25 | 20 | 16 | 12 |
|---|
| Precip. | 80 | 65 | 60 | 65 | 65 | 45 | 35 | 45 | 125 | 105 | 120 | 95 |
|---|
| Prec. days | 8 | 7 | 7 | 8 | 7 | 5 | 3 | 4 | 7 | 8 | 10 | 9 |
|---|
| Humidity | 73% | 69% | 65% | 65% | 63% | 59% | 54% | 56% | 65% | 74% | 77% | 75% |
|---|
| Day length | 9 | 10 | 12 | 14 | 15 | 15 | 15 | 14 | 12 | 11 | 10 | 9 |
|---|
| Sun hours | 4 | 5 | 6 | 7 | 9 | 11 | 12 | 11 | 8 | 6 | 4 | 4 |
|---|
| Sea temp | 13 | 12 | 13 | 14 | 18 | 22 | 24 | 25 | 23 | 20 | 17 | 15 |
|---|
| Zagreb |
|---|
|
| Jan | Feb | Mar | Apr | May | Jun | Jul | Aug | Sep | Oct | Nov | Dec |
|---|
| Min temp. | -2 | -1 | 2 | 7 | 11 | 15 | 16 | 16 | 12 | 8 | 4 | -1 |
|---|
| Max temp. | 5 | 8 | 13 | 18 | 22 | 26 | 28 | 28 | 22 | 17 | 11 | 5 |
|---|
| Precip. | 45 | 50 | 50 | 65 | 75 | 85 | 85 | 85 | 100 | 90 | 85 | 60 |
|---|
| Prec. days | 6 | 7 | 7 | 9 | 9 | 9 | 8 | 7 | 9 | 8 | 9 | 8 |
|---|
| Humidity | 81% | 72% | 64% | 61% | 62% | 63% | 62% | 63% | 71% | 78% | 82% | 84% |
|---|
| Day length | 9 | 10 | 12 | 14 | 15 | 16 | 15 | 14 | 12 | 11 | 10 | 9 |
|---|
| Sun hours | 2 | 4 | 5 | 6 | 8 | 8 | 9 | 9 | 6 | 4 | 2 | 2 |
|---|
|
| Zavizan (1,594 meters) |
|---|
|
| Jan | Feb | Mar | Apr | May | Jun | Jul | Aug | Sep | Oct | Nov | Dec |
|---|
| Min temp. | -6 | -6 | -4 | -1 | 4 | 7 | 9 | 10 | 6 | 2 | -2 | -5 |
|---|
| Max temp. | -1 | -1 | 1 | 4 | 10 | 14 | 17 | 17 | 13 | 8 | 3 | 0 |
|---|
| Precip. | 145 | 145 | 145 | 180 | 155 | 155 | 85 | 120 | 180 | 215 | 245 | 205 |
|---|
| Prec. days | 12 | 12 | 12 | 14 | 11 | 11 | 7 | 7 | 10 | 12 | 13 | 14 |
|---|
|
|
| Sun hours | 3 | 4 | 5 | 5 | 7 | 8 | 10 | 9 | 7 | 5 | 6 | 3 |
|---|
|
See also the
temperatures month by month