Select units of measurement for the temperature and rainfall tables (metric or imperial).
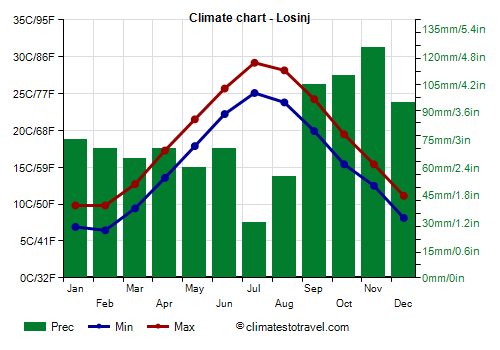
Average weather, temperature, rainfall, sunshine hours

The climate of Losinj is
Mediterranean, with mild, rainy winters and hot, sunny summers.
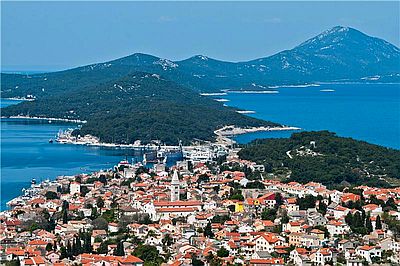
Lošinj is an island in Croatia, south of Istria. The main city is Mali Lošinj.
The
winter, from December to February, is mild (although it is not as mild as in the southern part of the Croatian coast), and is characterized by sunny periods alternating with periods of bad weather.
Sometimes, there can be
very cold days due to air masses coming from the interior of the Balkan Peninsula. In these cases, the temperature can drop slightly below freezing at night, while it can remain around freezing during the day. In December 1996, the temperature dropped to -4 °C (25 °F).
During these cold periods, light snowfalls can also occur.
The
summer, from June to August, is hot and sunny, with some afternoon thunderstorms, and a few rainy days, more likely in June.
Generally, the heat is not excessive and the breeze blows from the sea, however, there can be very hot and sultry periods, with highs of 34/35 °C (93/95 °F) and beyond. In August 2017, the temperature reached 39 °C (102 °F).

Best Time
The
best times to visit Losinj are spring and autumn, namely the months of May and September. In June, the weather is often excellent, but it can sometimes get hot, especially in the second half of the month.
To go to the beach, the best months are July and August. In June, the sea is still a little cool.
Losinj - Climate data
In Losinj, the
average temperature of the coldest month (February) is of
8.1 °C, that of the warmest month (July) is of
27.1 °C. Here are the average temperatures.
Losinj - Average temperatures (2004-2020) |
| Month | Min | Max | Mean |
|---|
| January | 6.9 | 9.8 | 8.4 |
|---|
| February | 6.5 | 9.8 | 8.1 |
|---|
| March | 9.4 | 12.7 | 11.1 |
|---|
| April | 13.6 | 17.3 | 15.4 |
|---|
| May | 17.9 | 21.5 | 19.7 |
|---|
| June | 22.2 | 25.7 | 24 |
|---|
| July | 25.1 | 29.2 | 27.1 |
|---|
| August | 23.8 | 28.2 | 26 |
|---|
| September | 19.9 | 24.2 | 22.1 |
|---|
| October | 15.4 | 19.5 | 17.4 |
|---|
| November | 12.5 | 15.4 | 14 |
|---|
| December | 8.1 | 11.1 | 9.6 |
|---|
| Year | 15.2 | 18.8 | 16.9 |
|---|
amounts to
930 millimeters per year: so, it is at an intermediate level. It ranges from
30 millimeters in the driest month (July) to
125 millimeters in the wettest one (November). Here is the average precipitation.
Losinj - Average precipitation| Month | Days |
|---|
| January | 75 | 8 |
|---|
| February | 70 | 7 |
|---|
| March | 65 | 7 |
|---|
| April | 70 | 8 |
|---|
| May | 60 | 7 |
|---|
| June | 70 | 6 |
|---|
| July | 30 | 4 |
|---|
| August | 55 | 5 |
|---|
| September | 105 | 7 |
|---|
| October | 110 | 8 |
|---|
| November | 125 | 10 |
|---|
| December | 95 | 8 |
|---|
| Year | 930 | 85 |
|---|
The
sea temperature ranges from
11.5 °C in February to
25.5 °C in August. Here are the average sea temperatures.
Losinj - Sea temperature| Month |
|---|
| January | 12.5 |
|---|
| February | 11.5 |
|---|
| March | 12 |
|---|
| April | 14 |
|---|
| May | 18 |
|---|
| June | 22 |
|---|
| July | 24.5 |
|---|
| August | 25.5 |
|---|
| September | 23 |
|---|
| October | 19.5 |
|---|
| November | 17"> |
|---|
| December | 14.5 |
|---|
| Year | 17.9 |
|---|
There are on average around 2575
sunshine hours per year. Here are the average hours of sunshine per day.
Losinj - Sunshine hours| Month | Average | Total |
|---|
| January | 3.5 | 110 |
|---|
| February | 5 | 145 |
|---|
| March | 6 | 185 |
|---|
| April | 7 | 215 |
|---|
| May | 9 | 280 |
|---|
| June | 10.5 | 315 |
|---|
| July | 11.5 | 355 |
|---|
| August | 10.5 | 325 |
|---|
| September | 8 | 245 |
|---|
| October | 6 | 185 |
|---|
| November | 4 | 115 |
|---|
| December | 3 | 100 |
|---|
| Year | 7 | 2575 |
|---|