Select units of measurement for the temperature and rainfall tables (metric or imperial).
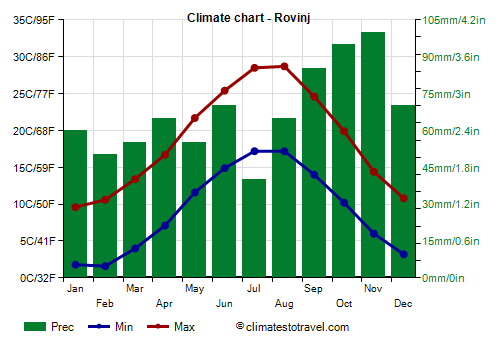
Average weather, temperature, rainfall, sunshine hours

The climate of Rovinj (Rovigno) can be described as
transitional Mediterranean.
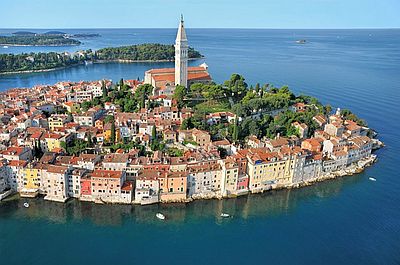
The city is located on the western coast of Istria, on the Upper Adriatic.
The
average temperature of the coldest month (January) is of 5.7 °C (42 °F), that of the warmest month (August) is of 23 °C (73 °F). Here are the average temperatures.
Rovinj - Average temperatures (1971-2000) |
| Month | Min | Max | Mean |
|---|
| January | 1.8 | 9.6 | 5.7 |
|---|
| February | 1.6 | 10.6 | 6.1 |
|---|
| March | 4 | 13.4 | 8.7 |
|---|
| April | 7.1 | 16.7 | 11.9 |
|---|
| May | 11.6 | 21.7 | 16.6 |
|---|
| June | 14.9 | 25.4 | 20.2 |
|---|
| July | 17.2 | 28.5 | 22.8 |
|---|
| August | 17.2 | 28.7 | 23 |
|---|
| September | 14 | 24.6 | 19.3 |
|---|
| October | 10.2 | 19.9 | 15 |
|---|
| November | 6 | 14.4 | 10.2 |
|---|
| December | 3.2 | 10.8 | 7 |
|---|
| Year | 9.1 | 18.7 | 13.9 |
|---|
amounts to 810 millimeters (31.9 inches) per year: so, it is at an intermediate level. It ranges from 40 mm (1.6 in) in the driest month (July) to 100 mm (3.9 in) in the wettest (November). Here is the average precipitation.
Rovinj - Average precipitation| Month | Days |
|---|
| January | 60 | 9 |
|---|
| February | 50 | 7 |
|---|
| March | 55 | 8 |
|---|
| April | 65 | 11 |
|---|
| May | 55 | 10 |
|---|
| June | 70 | 9 |
|---|
| July | 40 | 6 |
|---|
| August | 65 | 7 |
|---|
| September | 85 | 8 |
|---|
| October | 95 | 10 |
|---|
| November | 100 | 10 |
|---|
| December | 70 | 9 |
|---|
| Year | 810 | 102 |
|---|
The
winter is quite mild, although it is not as mild as on the southern coast of Croatia. The sirocco can bring mild and rainy days.
When the bora, the cold northeast wind, blows, the temperature can drop by several degrees. During the most intense cold spells, the temperature can drop as low as -6/-7 °C (19/21 °F) or less.
During these cold periods, snowfalls can also occur.
The
summer, from June to August, is hot and sunny, with some afternoon thunderstorms, and a few rainy days, more likely in June.
Generally, the heat is not excessive and the breeze blows from the sea, however, there can be very hot and sultry periods, with highs of 34/35 °C (93/95 °F) and beyond.

On average, there are around 2,420
sunshine hours per year. Here are the average sunshine hours per day.
Rovinj - Sunshine hours| Month | Average | Total |
|---|
| January | 3.5 | 100 |
|---|
| February | 5 | 140 |
|---|
| March | 5.5 | 175 |
|---|
| April | 6.5 | 200 |
|---|
| May | 8.5 | 270 |
|---|
| June | 9.5 | 290 |
|---|
| July | 10.5 | 330 |
|---|
| August | 10 | 305 |
|---|
| September | 7.5 | 230 |
|---|
| October | 5.5 | 175 |
|---|
| November | 3.5 | 110 |
|---|
| December | 3 | 95 |
|---|
| Year | 6.6 | 2420 |
|---|
The
sea temperature ranges between 10 °C (50 °F) and 26 °C (79 °F). The sea is warm enough for swimming from July to September. Here are the average sea temperatures.
Rovinj - Sea temperature| Month |
|---|
| January | 11.5 |
|---|
| February | 10.5 |
|---|
| March | 11 |
|---|
| April | 13.5 |
|---|
| May | 18 |
|---|
| June | 22.5 |
|---|
| July | 25 |
|---|
| August | 25.5 |
|---|
| September | 23 |
|---|
| October | 19.5 |
|---|
| November | 16.5"> |
|---|
| December | 14 |
|---|
| Year | 17.6 |
|---|
Best Time
The
best periods to visit Rovinj are spring and autumn, and in particular, from mid-April to mid-June and in the month of September. However, in both periods, some rainy days are possible.
The best months to go to the beach are July and August. In June, the sea is still a little cool.