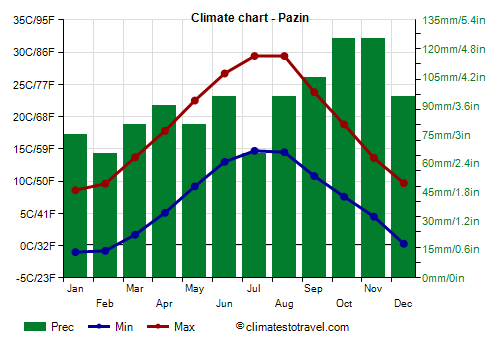
Select units of measurement for the temperature and rainfall tables (metric or imperial).
Average weather, temperature, rainfall, sunshine hours

The climate of Pazin is temperate, with quite cold winters and warm summers.
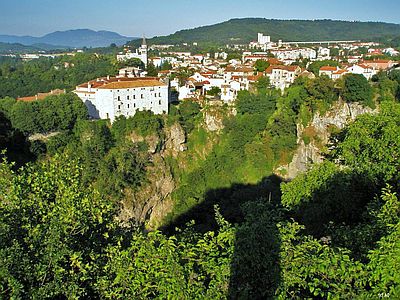
Pazin is located in the interior of Istria, at an altitude of 280 meters (920 feet).
The
winter is quite cold, although not as cold as in the interior of Croatia. In periods of stable weather, fog can form.
However, due to the distance from the sea and the altitude, it is colder than on the coasts of Istria. There can be very cold periods, in which the temperature drops to -10 °C (14 °F) or below. The cold record is -18.7 °C (-1.7 °F).
Sometimes it can even snow.
The
summer is warm during the day, but with cool nights, sometimes even a little cold. At night, the temperature can drop below 10 °C (50 °F) even in July and August. Thunderstorms can break out in the afternoon.
However, there may be very hot periods, in which the temperature can reach or exceed 35 °C (95 °F). The record is 38.7 °C (101.7 °F), recorded in August 2012 and August 2017.

Best Time
To visit Pazin, you can choose the months of June and September.
In July and August, the heat is generally bearable, but sometimes it can be intense. However, it is advisable to bring a sweater and a light jacket for the evening even in July and August.
Pazin - Climate data
In Pazin, the
average temperature of the coldest month (January) is of
3.8 °C, that of the warmest month (July) is of
22 °C. Here are the average temperatures.
Pazin - Average temperatures (1996-2020) |
| Month | Min | Max | Mean |
|---|
| January | -1 | 8.6 | 3.8 |
|---|
| February | -0.8 | 9.6 | 4.4 |
|---|
| March | 1.7 | 13.7 | 7.7 |
|---|
| April | 5.1 | 17.8 | 11.4 |
|---|
| May | 9.2 | 22.5 | 15.8 |
|---|
| June | 13 | 26.7 | 19.8 |
|---|
| July | 14.7 | 29.4 | 22 |
|---|
| August | 14.5 | 29.4 | 22 |
|---|
| September | 10.8 | 23.8 | 17.3 |
|---|
| October | 7.6 | 18.8 | 13.2 |
|---|
| November | 4.5 | 13.6 | 9 |
|---|
| December | 0.3 | 9.7 | 5 |
|---|
| Year | 6.7 | 18.7 | 12.65 |
|---|
amounts to
1065 millimeters per year: it is therefore quite abundant. It ranges from
65 millimeters in the driest months (February, July) to
125 millimeters in the wettest ones (October, November) Here is the average precipitation.
Pazin - Average precipitation| Month | Days |
|---|
| January | 75 | 7 |
|---|
| February | 65 | 6 |
|---|
| March | 80 | 7 |
|---|
| April | 90 | 8 |
|---|
| May | 80 | 9 |
|---|
| June | 95 | 9 |
|---|
| July | 65 | 6 |
|---|
| August | 95 | 6 |
|---|
| September | 105 | 8 |
|---|
| October | 125 | 9 |
|---|
| November | 125 | 9 |
|---|
| December | 95 | 8 |
|---|
| Year | 1065 | 92 |
|---|
There are on average around 2015
sunshine hours per year. Here are the average hours of sunshine per day.
Pazin - Sunshine hours| Month | Average | Total |
|---|
| January | 3 | 85 |
|---|
| February | 4 | 120 |
|---|
| March | 4.5 | 145 |
|---|
| April | 5.5 | 165 |
|---|
| May | 7 | 210 |
|---|
| June | 7.5 | 220 |
|---|
| July | 9 | 275 |
|---|
| August | 8.5 | 265 |
|---|
| September | 7 | 205 |
|---|
| October | 5 | 150 |
|---|
| November | 3 | 90 |
|---|
| December | 2.5 | 75 |
|---|
| Year | 5.5 | 2015 |
|---|