Select units of measurement for the temperature and rainfall tables (metric or imperial).
Average weather, temperature, rainfall, sunshine
In Uzbekistan, the climate is
arid continental in the vast steppe and desert plains of the central-western part, while it's still continental but moderately rainy (and snowy in winter) in the east, where hills and mountains are found.
Precipitation is typical of desert and semi-desert climates in the west, while it's slightly higher, at a semi-arid steppe level, in the central-eastern part. In the mountains, precipitation increases, especially on the more exposed slopes. Summer is sunny, and it's the driest season across the country.
Uzbekistan is exposed to cold air masses from Siberia, especially in the north-west, but also in the center-south, where, however, they alternate with warmer air masses coming from the south. The clash of different air masses can cause
strong winds, for instance, the warm wind blowing from the south-west, which can bring dust storms.
The climate in detail
The seasons
Winter, from December to February, is cold, especially in the north: the average
temperature in January is around -5 °C in the northernmost areas (the Aral Sea and the northern part of the Kyzyl Kum Desert), while it's slightly above freezing (0 °C or 32 °F) in the central cities of the ancient Silk Road (Tashkent, Samarkand, Bukhara). Only in the extreme south (see Termez), winter is quite mild, in fact the average in January goes up to 5 °C (41 °F).
However, the whole country can be reached by
cold waves of Siberian origin, during which the temperature can drop below -20 °C (-4 °F).
Summer, from June to August, is hot: the average temperature in July ranges from 27 °C (81 °F) in the north to 30 °C (86 °F) in the south. In the mountains, the temperature naturally decreases with altitude.
During
heatwaves, the temperature can exceed 40 °C (104 °F) throughout the country. Actually, in the extreme south the average high in July is already 40 °C (104 °F), and the records are around 46/47 °C (115/117 °F).
Eastern cities
As mentioned, in the east of Uzbekistan there are hills and mountains.
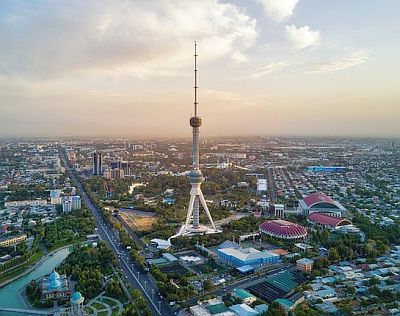
In the capital,
Tashkent, located in the east of the country, at 400 meters (1,300 feet) above sea level, the average temperature ranges from 3 °C (37.5 °F) in January to 28 °C (82.5 °F) in July.
From the mountains located south of the city, a dry down-slope wind can blow throughout the year, able to raise the temperature by several degrees.
In winter,
fog can form in stable periods.
In the last few decades, the winter temperature has increased by a few degrees, and also the summer temperature, though to a lesser extent, as happened in many countries of the former Soviet Union. During winter, however,
snowfalls and cold waves are quite frequent, though usually less intense than in the past. The record is -29 °C (-20 °F), while during more recent cold waves, in January 2008, in February 2012 and February 2014, the temperature reached -18 °C (0 °F).
In spring, from March to early May, clashes of air masses cause frequent winds, rain and sudden changes in temperature.
Summer, from June to August, is
very hot and sunny, with highs generally around 35/36 °C (95/97 °F) in July and August, but with peaks above 40 °C (104 °F).
Precipitation, about 460 mm (18 in) per year, occurs mostly from November to May, while in summer, it almost never rains. Although precipitation is not abundant, Tashkent is
the rainiest city in Uzbekistan.

In the easternmost part of the country we find the
Fergana Valley, enclosed between the mountains of the east and located between 400 and 600 metres above sea level, where cities such as
Namangan,
Andijan,
Fergana, Kokand, Margilan are found. Here the climate is similar to that of Tashkent, although more arid. In fact, precipitation varies from 180 to 250 millimeters (7 to 10 inches) per year.
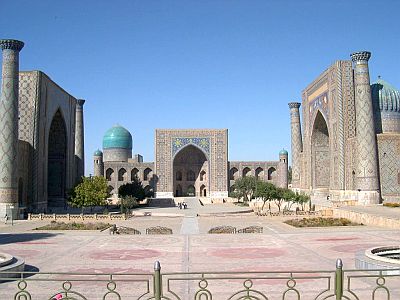
Samarkand, the old city and cultural crossroads on the Silk Road, located at 700 meters (2,300 feet) above sea level, has also a climate similar to that of Tashkent, though a little less hot in summer because of the higher altitude.
Annual precipitation is around 380 mm (15 in), so it's slightly lower than in the capital, but it follows a similar pattern, with a maximum in winter and spring and virtually no rain in summer.

The eastern part of Uzbekistan is home to several
mountain ranges, such as the
Pamir-Alaj, where the highest mountain in the country is found, Khazret Sultan, 4,643 meters (15,233 feet) high. More to the north, in the region of Tashkent, there is another mountainous area (the
western Tien-Shan), where we find the Ugam-Chatkal National Park, which has a diverse landscape, with lakes, forests, and canyons.
Southern plain
In southern Uzbekistan, we find a flat area, where, in comparison with the eastern cities, the climate is slightly milder in winter and hotter in summer. The rains are very poor.
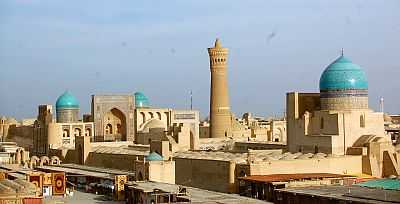
Bukhara (or Buxoro) is located practically at sea level, in the south-western desert zone, and in fact, it receives only 130 mm (5.1 in) of rain per year.
The temperature is not very different from that of the cities already mentioned, but it's a bit hotter in summer: the monthly average temperature ranges from 2.5 °C (36.5 °F) in January to 29.5 °C (85 °F) in July, when highs are normally about 37 °C (98.5 °F). Despite the low amount of precipitation, the city may experience some light snowfalls in winter.

In the far south, in
Termez, 300 meters (1,000 ft) above sea level and on the border with Afghanistan, the average temperature is higher, in fact, it ranges from 5.5 °C (42 °F) in January to 31 °C (87.5 °F) in July. Although the average is fairly mild, in winter, sometimes it snows, and even here, intense frosts can occur. Summer is scorchingly hot, and the average maximum in July is 40 °C (104 °F).
Cold deserts

In northwestern and central Uzbekistan, we find desert and semi-desert areas, where the climate is characterized by very cold winters, with averages below freezing, and hot summers.
The central-western part of the country is occupied by the vast
Kyzyl Kum Desert (or Qyzylqum), where the temperature can drop to -30 °C (-22 °F) in winter exceed 45 °C (113 °F) in summer, while in the far west, we find the
Ustyurt Plateau, another desert area, which, despite its name, has an average altitude of around 200 meters (650 feet).
The main river,
Amu Darya, flows towards the west and eventually reaches the area of the
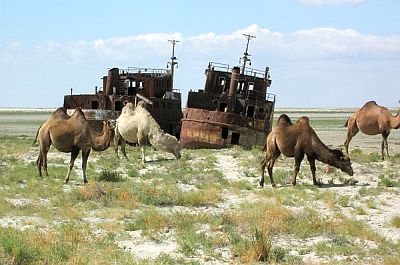
Aral Sea, a large salt lake located in the north-west of the country (the rest of the lake is located in Kazakhstan), which was once fed by the same river, but has shrunk over the decades because of exploitation for agriculture. Today, the river opens into a large delta, which partly dries up in the desert, while in the south-west, a smaller lake, Sarygamysh, was born from a branch of the river.
The other major river that once fed the Aral Sea, the
Syr Darya, rises in the Fergana Valley, and then heads west, entering neighboring Kazakhstan.
In
Nukus, in the Republic of Karakalpakstan, the average temperature ranges from -3 °C (26 °F) in January to 29 °C (84 °F) in July. The winter is definitely cold, in fact, the temperature remains below freezing even during the day for weeks.
The summer is a bit shorter and a bit cooler than in the central-southern plains.
Precipitation amounts to just 105 mm (4.2 in) per year, with a maximum of 15 mm (0.6 in) in March and April.

When to go
The best times to visit Uzbekistan are
spring and autumn in order to avoid the climate extremes to which the country is subject.
In particular, in most of the country (Tashkent, Samarkand, Fergana valley), you can choose April and October, while in the north-west (see the Aral Sea), you can choose the periods from mid-April to mid-May and from mid-September to mid-October.
What to pack
In
winter: pack very warm clothes, such as a down jacket, a hat, a scarf, and gloves; add some lighter clothes for mild days in the center and south (see Tashkent, Ferghana, Samarqand, Bukhara, Termez).
In
summer: pack lightweight clothes, loose-fitting and made of natural fabric (cotton or linen), a sun hat, and a desert turban. Add a sweatshirt for the evening, especially in the north and at an altitude of a few hundred meters (see Tashkent, Samarqand, Ferghana).
In the mountains, at intermediate altitudes, light clothes for the day, a sun hat, a sweatshirt and a light jacket for the evening, and hiking shoes. Above 3,000 meters (9,800 ft), bring a sweater and a jacket for the evening. Above 4,000 meters (13,000 ft), a down jacket, a hat, gloves, and a scarf.
It's better for women to avoid shorts and miniskirts.
Climate data - Uzbekistan
| Bukhara (225 meters) |
|---|
|
| Jan | Feb | Mar | Apr | May | Jun | Jul | Aug | Sep | Oct | Nov | Dec |
|---|
| Min temp. | -2 | 0 | 5 | 10 | 16 | 20 | 22 | 19 | 14 | 7 | 2 | -1 |
|---|
| Max temp. | 7 | 10 | 17 | 24 | 31 | 36 | 37 | 36 | 30 | 23 | 14 | 8 |
|---|
| Precip. | 15 | 25 | 25 | 20 | 10 | 0 | 0 | 0 | 0 | 5 | 15 | 15 |
|---|
| Prec. days | 10 | 10 | 10 | 8 | 7 | 3 | 1 | 1 | 1 | 4 | 8 | 9 |
|---|
|
|
|
|
| Fergana (600 meters) |
|---|
|
| Jan | Feb | Mar | Apr | May | Jun | Jul | Aug | Sep | Oct | Nov | Dec |
|---|
| Min temp. | -2 | 0 | 5 | 11 | 15 | 19 | 21 | 19 | 14 | 8 | 3 | -1 |
|---|
| Max temp. | 5 | 8 | 16 | 23 | 28 | 33 | 35 | 34 | 29 | 22 | 13 | 6 |
|---|
| Precip. | 15 | 20 | 25 | 20 | 20 | 15 | 5 | 5 | 5 | 15 | 20 | 20 |
|---|
| Prec. days | 4 | 4 | 5 | 5 | 5 | 3 | 2 | 1 | 1 | 3 | 4 | 4 |
|---|
| Humidity | 81% | 76% | 67% | 61% | 56% | 48% | 48% | 52% | 56% | 66% | 74% | 82% |
|---|
| Day length | 10 | 11 | 12 | 13 | 14 | 15 | 15 | 14 | 12 | 11 | 10 | 9 |
|---|
| Sun hours | 3 | 4 | 5 | 7 | 9 | 10 | 11 | 10 | 9 | 7 | 4 | 3 |
|---|
|
| Nukus |
|---|
|
| Jan | Feb | Mar | Apr | May | Jun | Jul | Aug | Sep | Oct | Nov | Dec |
|---|
| Min temp. | -8 | -6 | 1 | 9 | 15 | 20 | 21 | 19 | 12 | 5 | -1 | -6 |
|---|
| Max temp. | 1 | 4 | 13 | 22 | 30 | 35 | 36 | 35 | 28 | 20 | 10 | 3 |
|---|
| Precip. | 10 | 10 | 15 | 15 | 10 | 5 | 0 | 0 | 5 | 5 | 15 | 10 |
|---|
| Prec. days | 11 | 9 | 9 | 8 | 8 | 5 | 3 | 2 | 3 | 5 | 8 | 10 |
|---|
|
|
|
|
| Samarkand (700 meters) |
|---|
|
| Jan | Feb | Mar | Apr | May | Jun | Jul | Aug | Sep | Oct | Nov | Dec |
|---|
| Min temp. | -1 | 0 | 5 | 10 | 14 | 18 | 20 | 18 | 14 | 8 | 3 | 0 |
|---|
| Max temp. | 7 | 10 | 15 | 22 | 27 | 32 | 34 | 33 | 29 | 22 | 14 | 9 |
|---|
| Precip. | 40 | 50 | 75 | 65 | 40 | 5 | 0 | 0 | 5 | 15 | 40 | 40 |
|---|
| Prec. days | 7 | 8 | 10 | 7 | 6 | 2 | 1 | 0 | 0 | 3 | 6 | 7 |
|---|
| Humidity | 72% | 71% | 65% | 59% | 49% | 37% | 33% | 35% | 38% | 51% | 65% | 71% |
|---|
| Day length | 10 | 11 | 12 | 13 | 14 | 15 | 15 | 14 | 12 | 11 | 10 | 9 |
|---|
| Sun hours | 4 | 5 | 6 | 8 | 10 | 12 | 12 | 12 | 10 | 8 | 5 | 4 |
|---|
|
| Tashkent (400 meters) |
|---|
|
| Jan | Feb | Mar | Apr | May | Jun | Jul | Aug | Sep | Oct | Nov | Dec |
|---|
| Min temp. | -1 | 0 | 6 | 10 | 14 | 18 | 20 | 18 | 13 | 8 | 4 | 0 |
|---|
| Max temp. | 7 | 10 | 16 | 22 | 28 | 34 | 36 | 35 | 30 | 22 | 14 | 9 |
|---|
| Precip. | 55 | 70 | 65 | 65 | 40 | 15 | 5 | 0 | 5 | 25 | 50 | 60 |
|---|
| Prec. days | 8 | 8 | 9 | 8 | 5 | 3 | 1 | 0 | 0 | 3 | 6 | 8 |
|---|
| Humidity | 72% | 67% | 59% | 56% | 47% | 36% | 32% | 33% | 37% | 50% | 66% | 73% |
|---|
| Day length | 10 | 11 | 12 | 13 | 14 | 15 | 15 | 14 | 12 | 11 | 10 | 9 |
|---|
| Sun hours | 3 | 4 | 5 | 7 | 10 | 12 | 12 | 11 | 9 | 7 | 4 | 3 |
|---|
|
| Termez (300 meters) |
|---|
|
| Jan | Feb | Mar | Apr | May | Jun | Jul | Aug | Sep | Oct | Nov | Dec |
|---|
| Min temp. | 0 | 2 | 7 | 12 | 17 | 20 | 22 | 19 | 14 | 9 | 5 | 1 |
|---|
| Max temp. | 11 | 14 | 20 | 27 | 33 | 38 | 40 | 38 | 33 | 26 | 18 | 12 |
|---|
| Precip. | 25 | 30 | 30 | 25 | 10 | 0 | 0 | 0 | 0 | 5 | 20 | 20 |
|---|
| Prec. days | 10 | 11 | 11 | 9 | 6 | 2 | 0 | 0 | 1 | 3 | 8 | 9 |
|---|
|
|
| Sun hours | 5 | 6 | 7 | 9 | 11 | 13 | 13 | 12 | 11 | 9 | 6 | 5 |
|---|
|
See also the
temperatures month by month