Select units of measurement for the temperature and rainfall tables (metric or imperial).
Climate in Bukhara (Uzbekistan)
Average weather, temperature, rainfall, sunshine hours
You are here:
Home -->
Asia -->
Uzbekistan --> Bukhara

The climate of Bukhara is
arid continental
Bukhara (in Uzbek Buxoro) is a city of 280,000 inhabitants, located in the south of Uzbekistan, at 225 meters (740 feet) above sea level and at almost 40 degrees north latitude.
About 80 km (50 mi) to the southwest is the border with Turkmenistan.
The city is located on the ancient Silk Road.
The Zarafshon (or Zeravshan) River passes through the city and then flows into the Amu Darya, without reaching it, as it did in the past, but dispersing its waters into the desert.

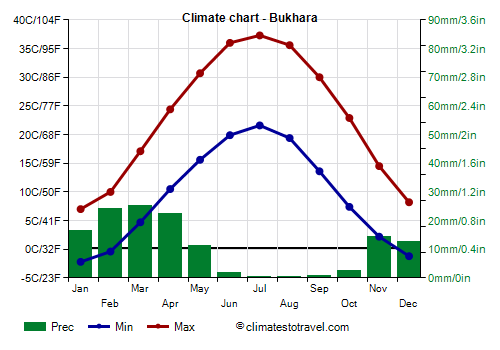
Precipitation is decidedly scarce, amounting to 130 millimeters (5.1 inches) per year. Summer is the driest season.
The winter, from December to February, is quite cold, with an average January temperature of around 2.5 °C (36.5 °F).
During periods of stable weather, fog can form.
There are quite mild periods, during which the temperature can reach or exceed 15 °C (59 °F), especially in December and February, and more rarely in January.
Due to the arid climate, both rain and snowfall are quite rare, and in any case generally not abundant.
During cold spells, the temperature typically drops to -10 °C (-14 °F). Once every few years it can drop to -15 °C (5 °F) or below. In January 2008 it dropped to -23.5 °C (-9.5 °F), and in January 2023 to -21 °C (-6 °F).
Summer, from June to August, is very hot and sunny. The average in July is 29.5 °C (85 °F).
On the hottest days, the temperature exceeds 40 °C (104 °F). The heat records are of 45/46 °C (113/115 °F).
In July 2019, the average maximum was 40.2 °C (104.4 °F).
Bukhara - Climate data
In Bukhara, the average temperature of the coldest month (January) is of 2.4 °C, that of the warmest month (July) is of 29.4 °C. Here are the average temperatures.Bukhara - Average temperatures (1991-2020) |
| Month | Min | Max | Mean |
|---|
| January | -2.2 | 7 | 2.4 |
|---|
| February | -0.4 | 10 | 4.8 |
|---|
| March | 4.7 | 17.1 | 10.9 |
|---|
| April | 10.5 | 24.4 | 17.4 |
|---|
| May | 15.6 | 30.7 | 23.2 |
|---|
| June | 19.9 | 36 | 28 |
|---|
| July | 21.6 | 37.3 | 29.4 |
|---|
| August | 19.4 | 35.6 | 27.5 |
|---|
| September | 13.6 | 30 | 21.8 |
|---|
| October | 7.4 | 22.9 | 15.2 |
|---|
| November | 2.2 | 14.5 | 8.4 |
|---|
| December | -1.2 | 8.2 | 3.5 |
|---|
| Year | 9.3 | 22.9 | 16.05 |
|---|
amounts to
130 millimeters per year: it is therefore at a desert level. It ranges from
0.3 millimeters in the driest month (August) to
25.1 millimeters in the wettest one (March). Here is the average precipitation.
Bukhara - Average precipitation| Month | Days |
|---|
| January | 16 | 10 |
|---|
| February | 24 | 10 |
|---|
| March | 25 | 10 |
|---|
| April | 22 | 8 |
|---|
| May | 11 | 7 |
|---|
| June | 2 | 3 |
|---|
| July | 0 | 1 |
|---|
| August | 0 | 1 |
|---|
| September | 1 | 1 |
|---|
| October | 3 | 4 |
|---|
| November | 14 | 8 |
|---|
| December | 13 | 9 |
|---|
| Year | 130 | 72 |
|---|
© Copyright Climatestotravel.com.
Back to
Asia -->
Uzbekistan
All the countries