Select units of measurement for the temperature and rainfall tables (metric or imperial).
Average weather, temperature, rainfall, sunshine
In the Central African Republic, the climate is
tropical, hot all year round.
There is a
dry season that has its center in winter, from December to February, and is longer in the north than in the south.
Then there is a
rainy season, which lasts for most of the year in the south, and is limited to the summer months in the north. In the rainiest period, from July to September in the center-north and from May to October in the south, the rains can cause flooding.
Most of the country is occupied by a
plateau, whose altitude ranges between 400 and 800 meters (1,300 and 2,600 feet). In the westernmost part, it reaches around a thousand meters (3,300 feet) in the prefectures of Nana-Mbamberé and Ouham-Pendé (see cities such as Bouar and Bocaranga), where also the highest point of the country is found,
Mount Ngaoui, at the border with Cameroon, 1,374 meters (4,419 feet) high.
The country is covered by
savanna, and in large areas of the center-south also by rainforests; in the far north, there is instead a drier strip close to the Sahel.
The amount of
sunshine in the Central African Republic is higher in winter than in summer, in addition, it is higher in the north than in the south. In fact, in the north, the dry season is longer, and it is also more easily sunny, while in the south, the rainy season is longer, and in the winter dry season, the sun does not always shine because cloud banks are relatively frequent.
The Central African Republic is a country located south of the Sahara and north of the Equator.
The climate in detail
Far north
In the far north, the
hottest and driest area, the rains do not reach 900 millimeters (35.5 inches) per year, and the rainy season lasts just a little longer than four months, from late May to early October.
In winter, nights are cool, and can sometimes be a bit cold. However, during the day, it gets hot: the maximum temperatures hover around 33/34 °C (91/93 °F), but sometimes, they can rise even higher. The wind from the north-east, the
harmattan, brings sand particles from the Sahara and raises clouds of dust.
By February, the temperature rises, and
the hottest time of year begins, during which highs can exceed 40 °C (104 °F).
In the second half of May, showers and downpours begin to occur, so the temperature drops, but in return, relative humidity increases.
In October, good weather returns and the temperature rises again, with some hot days, but less than in spring.
Birao
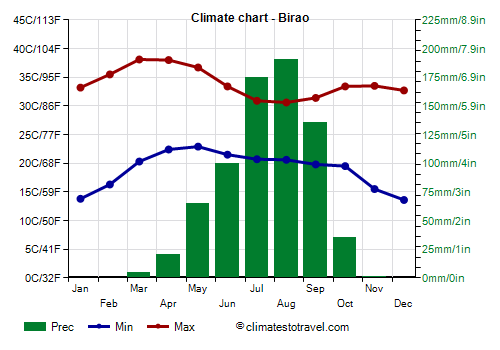
In Birao, located in the far north, at 450 meters (1,450 ft) above sea level, the average temperature ranges from around 23 °C (73.5 °F) in December to around 30 °C (86 °F) in April and May.
Rainfall amounts to 725 mm (28.5 in) per year.
In the far north, the sun shines regularly in the dry season, while in the rainy season, the hours of sunshine decrease a little. July and August are the least sunny months.
North-central
Further to the south, in the
north-central region (see Ndelé), winter is even hotter, but then, the scorching period of spring is less evident because rains and cloud banks arrive earlier.
Ndelé
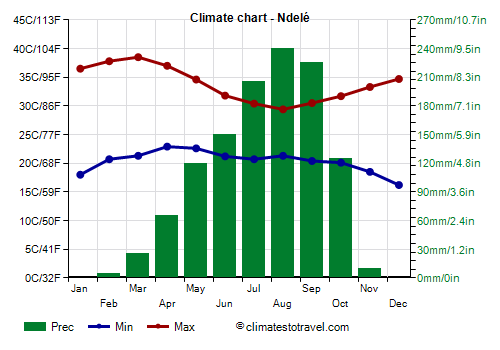
In
Ndelé, during the day the hottest months are March and April, while the least hot period goes from July to September.
In the north-central, precipitation hovers around 1,150/1,300 mm (45/51 in) per year. The rainy season is longer and runs from May to October, with some showers already in late March and in April.
In the center-north too, the sky is often clear or mostly clear in winter, while in the rainy period, the sky becomes cloudy more often and for a longer period.
In the north-central, we find the
Manovo-Gounda St. Floris National park, a World Heritage Site by UNESCO, unfortunately at risk because of illegal hunting and poaching. The park is home to several animal species such as elephants, leopards, cheetahs, African buffaloes, and West African black rhinos, which, however, were declared extinct in 2011.
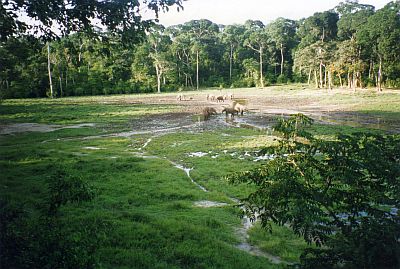
As we mentioned, in the
far west, there are areas located at an altitude of around a thousand meters (3,300 feet). Here, the altitude tempers the climate, and in summer, at the height of the rainy season, days can be even a little cool.
Bouar
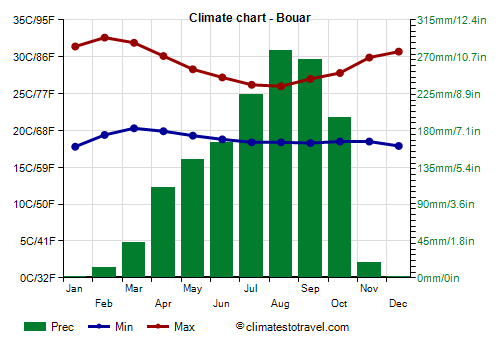
In
Bouar, at 1,000 meters above sea level, the average temperature ranges from around 22 °C (71.5 °F) in August to around 26 °C (79 °F) in February and March.
On average, 1,450 mm (57 in) of rain fall per year, of which more than 100 mm (4 in) fall per month from April to October, with a maximum of 265/275 mm (10.4/10.8 in) per month in August and September.
South
In the south,
the rainiest area, the dry season is limited to the three winter months, from December to February, when some occasional showers may still occur.
Bangui
The capital,
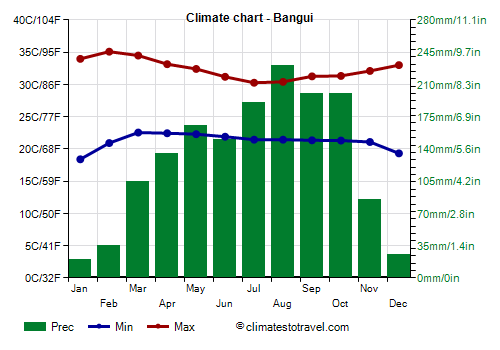
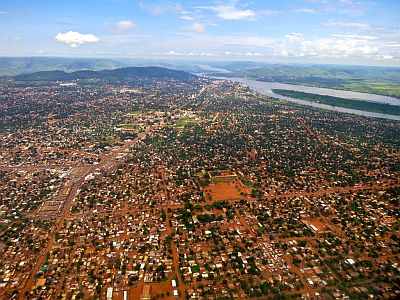
Bangui, is located in the south, on the banks of the Ubangi River, at the border with the Democratic Republic of Congo, and at 350 meters (1,150 ft) above sea level (the lowest altitude of the country).
Here, the temperatures are more uniform throughout the year, however, in winter, the temperature range is higher, and it exceeds 30 °C (86 °F) during the day. During the day, the hottest period goes from January to March, both because the latitude is lower (and therefore the sun is very strong even in winter), and because the rains start earlier.
In Bangui, about 1,500 millimeters (60 inches) of rain fall per year. The rainiest period is from July to October, when precipitation hovers around 190/220 mm (7.5/8.7 in) per month.
In Bangui, the sun does not shine very often, even in the short dry season, while in the rainy season, the sky is often cloudy.
When to go
The best time to travel to the Central African Republic is
winter, from December to February, since it's the dry season. Days can be hot, especially at low altitudes and in the center-north. At night, however, it can sometimes be a bit cold in the north.
By February, temperatures start to rise, so you may prefer the month of December and January.
What to pack
In
winter: in the far north, bring light clothes for the day, long and made of natural fibers (cotton or linen), a turban for the desert wind, a jacket and a sweater for the evening, and comfortable boots or sandals. In the south and Bangui, light clothing, a light sweatshirt for the evening, a light jacket for any very cool nights, and a scarf for the wind full of dust.
In
summer: bring light clothing, long and of natural fabric (cotton or linen); a sweatshirt and an umbrella or a light raincoat for the rain showers. For the areas at higher altitude (Bouar, Bocaranga), you can add a light jacket.
It's better for women to avoid shorts and miniskirts.
Climate data - Central African Republic
| Bangui (350 meters) |
|---|
|
| Jan | Feb | Mar | Apr | May | Jun | Jul | Aug | Sep | Oct | Nov | Dec |
|---|
| Min temp. | 18 | 21 | 23 | 22 | 22 | 22 | 21 | 21 | 21 | 21 | 21 | 19 |
|---|
| Max temp. | 34 | 35 | 35 | 33 | 32 | 31 | 30 | 30 | 31 | 31 | 32 | 33 |
|---|
| Precip. | 10 | 45 | 100 | 120 | 150 | 160 | 195 | 220 | 175 | 200 | 70 | 20 |
|---|
| Prec. days | 1 | 3 | 7 | 8 | 9 | 10 | 12 | 12 | 11 | 12 | 7 | 2 |
|---|
| Humidity | 60% | 60% | 69% | 76% | 78% | 81% | 84% | 84% | 82% | 83% | 80% | 69% |
|---|
| Day length | 12 | 12 | 12 | 12 | 12 | 12 | 12 | 12 | 12 | 12 | 12 | 12 |
|---|
| Sun hours | 7 | 7 | 7 | 6 | 6 | 6 | 5 | 5 | 5 | 5 | 7 | 8 |
|---|
|
| Berbérati (580 meters) |
|---|
|
| Jan | Feb | Mar | Apr | May | Jun | Jul | Aug | Sep | Oct | Nov | Dec |
|---|
| Min temp. | 17 | 19 | 20 | 20 | 20 | 20 | 19 | 20 | 19 | 20 | 19 | 18 |
|---|
| Max temp. | 32 | 34 | 33 | 32 | 31 | 30 | 29 | 29 | 30 | 30 | 31 | 32 |
|---|
| Precip. | 10 | 35 | 90 | 140 | 175 | 165 | 195 | 195 | 245 | 250 | 100 | 15 |
|---|
| Prec. days | 1 | 2 | 7 | 10 | 12 | 11 | 13 | 12 | 15 | 18 | 9 | 2 |
|---|
|
|
| Sun hours | 8 | 7 | 7 | 7 | 6 | 6 | 5 | 5 | 6 | 6 | 8 | 8 |
|---|
|
| Birao (450 meters) |
|---|
|
| Jan | Feb | Mar | Apr | May | Jun | Jul | Aug | Sep | Oct | Nov | Dec |
|---|
| Min temp. | 14 | 16 | 20 | 22 | 23 | 22 | 21 | 21 | 20 | 20 | 16 | 14 |
|---|
| Max temp. | 33 | 36 | 38 | 38 | 37 | 33 | 31 | 31 | 31 | 33 | 34 | 33 |
|---|
| Precip. | 0 | 0 | 5 | 20 | 65 | 100 | 175 | 190 | 135 | 35 | 0 | 0 |
|---|
| Prec. days | 0 | 0 | 1 | 3 | 7 | 10 | 14 | 17 | 12 | 5 | 1 | 0 |
|---|
|
|
| Sun hours | 10 | 10 | 9 | 9 | 9 | 8 | 7 | 7 | 8 | 9 | 10 | 10 |
|---|
|
| Bouar (1,000 meters) |
|---|
|
| Jan | Feb | Mar | Apr | May | Jun | Jul | Aug | Sep | Oct | Nov | Dec |
|---|
| Min temp. | 18 | 19 | 20 | 20 | 19 | 19 | 18 | 18 | 18 | 18 | 18 | 18 |
|---|
| Max temp. | 31 | 33 | 32 | 30 | 28 | 27 | 26 | 26 | 27 | 28 | 30 | 31 |
|---|
| Precip. | 0 | 15 | 45 | 110 | 145 | 165 | 225 | 280 | 265 | 195 | 20 | 0 |
|---|
| Prec. days | 0 | 2 | 5 | 9 | 12 | 13 | 16 | 18 | 18 | 15 | 2 | 0 |
|---|
|
|
| Sun hours | 8 | 8 | 7 | 7 | 7 | 6 | 5 | 4 | 5 | 6 | 8 | 8 |
|---|
|
| Ndelé (500 meters) |
|---|
|
| Jan | Feb | Mar | Apr | May | Jun | Jul | Aug | Sep | Oct | Nov | Dec |
|---|
| Min temp. | 18 | 21 | 21 | 23 | 23 | 21 | 21 | 21 | 20 | 20 | 18 | 16 |
|---|
| Max temp. | 36 | 38 | 38 | 37 | 35 | 32 | 30 | 29 | 30 | 32 | 33 | 35 |
|---|
| Precip. | 0 | 5 | 25 | 65 | 120 | 150 | 205 | 240 | 225 | 125 | 10 | 0 |
|---|
| Prec. days | 0 | 2 | 4 | 6 | 10 | 11 | 15 | 18 | 14 | 10 | 3 | 0 |
|---|
|
|
| Sun hours | 9 | 9 | 8 | 7 | 7 | 6 | 5 | 5 | 5 | 6 | 9 | 9 |
|---|
|
See also the
temperatures month by month