Select units of measurement for the temperature and rainfall tables (metric or imperial).
Average weather, temperature, rainfall, sunshine hours
The climate of Badulla is
tropical, hot all year round, although tempered by the altitude, with a relatively dry season in summer, from June to August, and a rainy season from October to January.
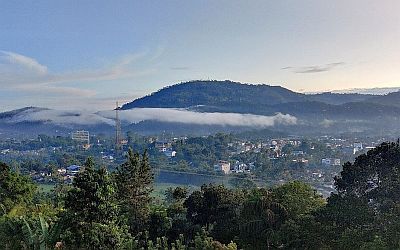
Badulla is a city of 47,000 inhabitants, located in the south-east of Sri Lanka, in the Province of Uva, and at 680 meters (2,230 feet) above sea level. We are in the area of Sri Lanka occupied by mountains and plateaus. To the south-east are the Namunukula mountains, which reach 2,036 meters (6,680 feet) in height.

In Sri Lanka,
rainfall depends on slope exposure. In this area, the
northeast monsoon produces heavy rains from October to January.
In April, the month in which the sun passes at the zenith, there is an increase in rainfall, which can continue also in May.
From June to August, the period of the
southwest monsoon, rainfall is rare, since this area is on the eastern side.
Sri Lanka is in the path of
tropical cyclones. Typically, on the Indian Ocean north of the Equator, cyclones occur from April to December, although Sri Lanka is usually only affected in November and December, and more rarely in May. In fact, usually in mid-May, sometimes there can be heavy rains, caused by cyclones that form in the Bay of Bengal, even if they are at the beginning of their life. However, since the sea is warm all year round, in theory they can also form from January to March, perhaps in a light form (such as tropical storms).
Best Time
The best months to visit Badulla are February and March, along with the summer period, from June to August, being the two driest periods of the year. The worst period is from October to December, being the rainiest.
Badulla - Climate data
In Badulla, the
average temperature of the coldest month (January) is of
21.6 °C, that of the warmest month (May) is of
25.4 °C. Here are the average temperatures.
Badulla - Average temperatures (1991-2020) |
| Month | Min | Max | Mean |
|---|
| January | 17.7 | 25.5 | 21.6 |
|---|
| February | 17.5 | 27.2 | 22.4 |
|---|
| March | 17.7 | 29.7 | 23.7 |
|---|
| April | 19.3 | 30.6 | 25 |
|---|
| May | 19.6 | 31.1 | 25.4 |
|---|
| June | 19.2 | 31.1 | 25.2 |
|---|
| July | 18.9 | 31.1 | 25 |
|---|
| August | 18.7 | 31.2 | 25 |
|---|
| September | 18.7 | 30.7 | 24.7 |
|---|
| October | 18.9 | 29.2 | 24 |
|---|
| November | 19.1 | 27.2 | 23.2 |
|---|
| December | 18.6 | 25.6 | 22.1 |
|---|
| Year | 18.7 | 29.2 | 23.9 |
|---|
amounts to
1760 millimeters per year: it is therefore abundant. It ranges from
51.6 millimeters in the driest month (June) to
285.7 millimeters in the wettest one (November). Here is the average precipitation.
Badulla - Average precipitation| Month | Days |
|---|
| January | 184 | 12 |
|---|
| February | 102 | 8 |
|---|
| March | 88 | 7 |
|---|
| April | 184 | 13 |
|---|
| May | 120 | 10 |
|---|
| June | 52 | 5 |
|---|
| July | 54 | 5 |
|---|
| August | 72 | 6 |
|---|
| September | 107 | 9 |
|---|
| October | 242 | 15 |
|---|
| November | 286 | 19 |
|---|
| December | 270 | 17 |
|---|
| Year | 1760 | 126 |
|---|