Select units of measurement for the temperature and rainfall tables (metric or imperial).
Average weather, temperature, rainfall, sunshine hours

New Plymouth has an
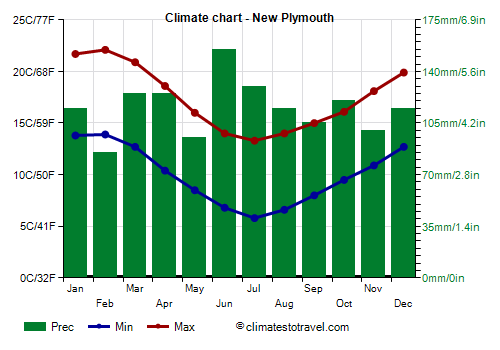
oceanic climate, with mild winters (from June to August) and very mild summers (from December to March). The rains are abundant and are well distributed throughout the year, even though they are a little less frequent in summer. Being in the southern hemisphere, the seasons are reversed compared to the northern hemisphere.
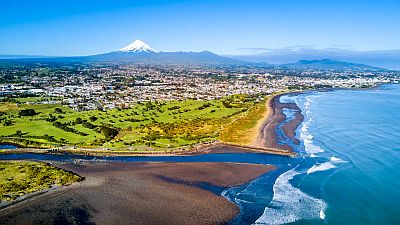
The city, called Ngamotu in Maori, is located on the west coast of the North Island of New Zealand, in Taranaki region, at 39 degrees south latitude. About 25 km (15 mi) to the south is Egmont National Park, which hosts Taranaki volcano, 2,518 meters (8,261 feet) high. About 120 km (75 mi) to the east, on the other hand, is Ruapehu volcano, the highest mountain on the North Island with its 2,797 meters (9,176 ft).

Because of the location on the west coast, the climate is more rainy and windy, and cooler in summer, than in the rest of the North Island.
In
winter, sometimes there can be quite cold periods, with lows near freezing and highs of 10/12 °C (50/54 °F). At night, the temperature rarely drops below freezing, however, occasionally it can drop to -1/-2 °C (28/30 °F) from late May to early October.
Snow in New Plymouth is extremely rare. In August 2011, there was a snowfall without accumulation.
In
summer, there can be cool, windy and rainy days, with highs of 18/19 °C (64/66 °F). Even when it's not raining, the ocean breeze increases the feeling of coolness.
On the warmest days, the temperature usually reaches 26/27 °C (79/81 °F). The heat record is 30 °C (86 °F).
From time to time, the North Island can be affected by
tropical cyclones, which can leave the tropical zone and head south. In the last few decades, tropical cyclones or their remains have affected New Zealand from mid-December to April 20, with a higher frequency from January to March.
Best Time
The best time to visit New Plymouth is the summer, from December to February, as it is the warmest and sunniest of the year. However, even in summer there can be cool, rainy and windy periods.
In addition, it should be remembered that tropical cyclones or their remnants can come from time to time.
For swimming, the ocean is very cool even in summer.
New Plymouth - Climate data
In New Plymouth, the
average temperature of the coldest month (July) is of
9.6 °C, that of the warmest month (February) is of
18 °C. Here are the average temperatures.
New Plymouth - Average temperatures (1981-2010) |
| Month | Min | Max | Mean |
|---|
| January | 13.8 | 21.7 | 17.8 |
|---|
| February | 13.9 | 22.1 | 18 |
|---|
| March | 12.7 | 20.9 | 16.8 |
|---|
| April | 10.4 | 18.6 | 14.5 |
|---|
| May | 8.5 | 16 | 12.2 |
|---|
| June | 6.8 | 14 | 10.4 |
|---|
| July | 5.8 | 13.3 | 9.6 |
|---|
| August | 6.6 | 14 | 10.3 |
|---|
| September | 8 | 15 | 11.5 |
|---|
| October | 9.5 | 16.1 | 12.8 |
|---|
| November | 10.9 | 18.1 | 14.5 |
|---|
| December | 12.7 | 19.9 | 16.3 |
|---|
| Year | 9.9 | 17.4 | 13.65 |
|---|
amounts to
1400 millimeters per year: it is therefore quite abundant. It ranges from
85 millimeters in the driest month (February) to
155 millimeters in the wettest one (June). Here is the average precipitation.
New Plymouth - Average precipitation| Month | Days |
|---|
| January | 115 | 9 |
|---|
| February | 85 | 8 |
|---|
| March | 125 | 10 |
|---|
| April | 125 | 10 |
|---|
| May | 95 | 12 |
|---|
| June | 155 | 14 |
|---|
| July | 130 | 13 |
|---|
| August | 115 | 13 |
|---|
| September | 105 | 13 |
|---|
| October | 120 | 14 |
|---|
| November | 100 | 10 |
|---|
| December | 115 | 10 |
|---|
| Year | 1400 | 136 |
|---|
The
sea temperature ranges from
13.5 °C in August, September to
19.5 °C in February. Here are the average sea temperatures.
New Plymouth - Sea temperature| Month |
|---|
| January | 18 |
|---|
| February | 19.5 |
|---|
| March | 19 |
|---|
| April | 18 |
|---|
| May | 16.5 |
|---|
| June | 15 |
|---|
| July | 14 |
|---|
| August | 13.5 |
|---|
| September | 13.5 |
|---|
| October | 14 |
|---|
| November | 15"> |
|---|
| December | 16.5 |
|---|
| Year | 16 |
|---|
There are on average around 2200
sunshine hours per year. Here are the average hours of sunshine per day.
New Plymouth - Sunshine hours| Month | Average | Total |
|---|
| January | 8 | 250 |
|---|
| February | 8 | 225 |
|---|
| March | 7 | 215 |
|---|
| April | 6 | 180 |
|---|
| May | 4.5 | 145 |
|---|
| June | 4 | 120 |
|---|
| July | 4.5 | 140 |
|---|
| August | 5 | 165 |
|---|
| September | 5.5 | 165 |
|---|
| October | 6 | 190 |
|---|
| November | 7 | 205 |
|---|
| December | 7 | 210 |
|---|
| Year | 6 | 2200 |
|---|