Select units of measurement for the temperature and rainfall tables (metric or imperial).
Average weather, temperature, rainfall, sunshine
Fiji has a
tropical climate, with a hot, humid, and rainy season from December to April and a cooler season from June to October.
Fiji is an archipelago located in the South Pacific Ocean, north of the Tropic of Capricorn. The main islands are located between 16 and 18 degrees south latitude.
The climate in detail
Vanua Levu and Viti Levu
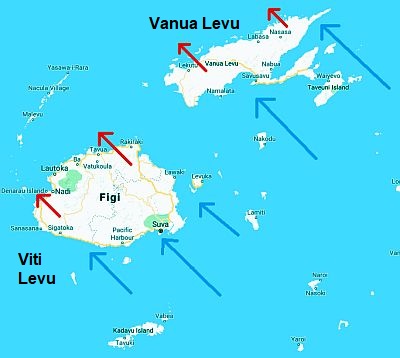
The cool season from June to October is relatively dry, especially on the small and flat islands, but also on the north-western slopes of the main islands (Viti Levu and Vanua Levu), while on the slopes exposed to the south-east, the
trade winds can cause showers and thunderstorms even in this season.
In the following image, we can see, in a schematic way, the south-east trade winds blowing in the cool season, which are
cool and humid on the exposed sides, and warmer and drier on the downwind sides.
Suva
For example, in the capital,
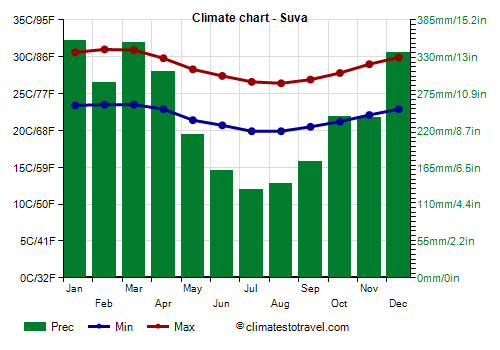
Suva, located on the south-eastern coast of the island of Viti Levu, and therefore exposed to the trade winds, up to 2,950 millimeters (115 inches) of rain fall per year, of which more than 290 mm (11.5 in) fall per month from December to April, when it rains more than 17 days a month.
However, even in the least rainy months, July and August, it rains for 12/13 days a month, and the minimum is no less than 130 mm (5.1 in) in July.
The daytime
temperatures in Suva, which are around 30/31 °C (86/88 °F) from December to March, drop to 26/27 °C (79/81 °F) from May to September; even the night-time temperatures drop by a few degrees.
Furthermore, from May to October, but especially from July to September,
cool air masses can sometimes arrive from the south, and the temperature can drop to 14/15 °C (57/59 °F) at night and 23/24 °C (73/75 °F) during the day.
In Suva, there are not many sunshine hours because clouds can form all year round.
The
sea temperature decreases a bit in the winter months, although it remains pleasantly warm for swimming, in fact it drops to 25 °C (77 °F) in August and September.
In the interior of the island of Viti Levu, there are hills and mountains, the highest peak of which is Mount
Tomanivi, 1,324 meters (4,344 feet) high.
At the
Monasavu Dam, at 800 meters (2,600 feet) above sea level, the average temperature ranges from 18.5 °C (65 °F) in July to almost 23 °C (73.5 °F) in February and March. Rainfall is very abundant, amounting to almost 5 meters (196 in) per year.
The western side, in the leeward side of the trade winds, is instead less rainy.
Nadi
In
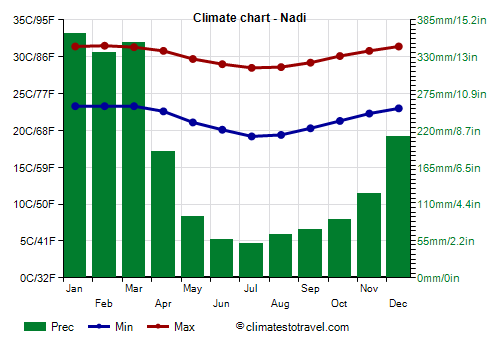
Nadi, on the western slope of the same island of Viti Levu, rainfall is much lower than in Suva, 2,000 mm (78 in) per year. While it rains a lot from December to April, it rains much less from May to October, when precipitation drops below 100 mm (4 in) per month; the driest month is July, with 50 mm (2 in) of rain. The rainy days are fewer as well.
In contrast, the temperature on the western side is
a little higher because the winds blow from the inland hills, especially in the coolest months, July and August, when the maximum temperature is around 28.5 °C (83 °F) instead of 26.5 °C (79.5 °F).
Here, too however, in the austral winter there may be
cool periods, but generally the temperature decreases especially at night, while during the day it usually reaches or exceeds 25 °C (77 °F). In July 1993 it dropped to 12 °C (53.5 °F).
The amount of sunshine too, is higher on the leeward side than on the windward side, especially in the cool period: about 7/8 hours per day in Nadi, compared to the 5/6 hours of Suva.
These differences between the two sides are also found on the other main island,
Vanua Levu.
On the
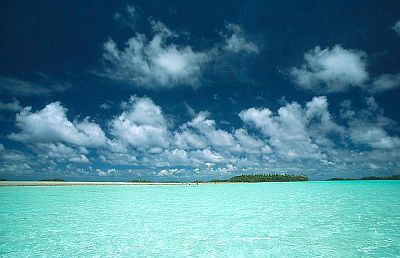
smaller islands, especially the flat ones (see Lakeba, Ono-i-Lau, the Yasawa Islands), the difference is lower because the trade winds do not find elevations upon which they could release moisture on one side, so these islands receive about 1,700/1,800 mm (67/71 in) of rain per year, with a minimum in the coolest months.
Rotuma
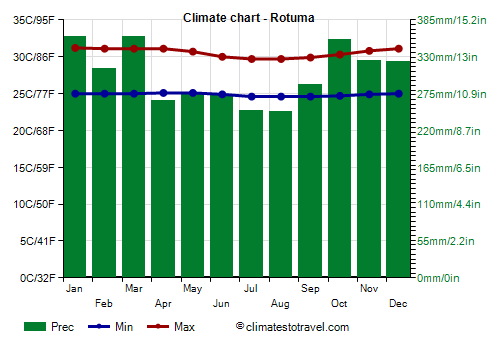
The island of
Rotuma, located far to the north (at 12 degrees south latitude), represents an exception, and it's very rainy because of the latitude: with its 3,600 mm (141 in) of rain per year, it has an equatorial climate, with a minimum in July and August, when still around 250 mm (10 in) of rain fall per month.
This island is also warmer, especially in winter, which actually does not exist, and therefore has stable temperatures throughout the year.
In Rotuma, the temperature of the sea remains high throughout the year as well, in fact it never drops below 28 °C (82.5 °F).
Tropical cyclones
Fiji can be affected by
tropical cyclones. Cyclones are usually formed from November to mid-May, though they are most likely from late December to early April. Outside of this period, there has been Cyclone Bebe, which affected this area in the second half of October 1972. The risk of cyclones is one more reason to avoid the muggy and rainy season.
In addition, the Fiji Islands are affected by the climate cycle called ENSO: during the most intense
El Niño years, such as 1983 and 1998, they experienced a noticeable decrease in precipitation.
When to go
The best time to visit Fiji is from
mid-May to mid-October: it's the most dry, cool and sunny, especially on the north-western slopes of the main islands, which are preferable also because they are more sheltered from the wind.
What to pack
In
winter (June to August): bring light clothes for the day, a scarf for the breeze, a sweatshirt for the evening, and a light raincoat or umbrella. When going to the reef, you can bring snorkeling equipment, including water shoes or rubber-soled shoes.
In
summer (December to February): bring light clothes of natural fibers, a sun hat, a scarf for the breeze, a light sweatshirt for the evening, and a light raincoat or umbrella.
In
Rotuma, all year round, bring light clothing of natural fibers, a sun hat, a scarf for the breeze, a light sweatshirt for the evening, and a light raincoat or umbrella.
Climate data - Fiji
| Labasa |
|---|
|
| Jan | Feb | Mar | Apr | May | Jun | Jul | Aug | Sep | Oct | Nov | Dec |
|---|
| Min temp. | 22 | 22 | 22 | 22 | 20 | 19 | 18 | 19 | 20 | 20 | 22 | 22 |
|---|
| Max temp. | 32 | 32 | 32 | 32 | 31 | 30 | 30 | 30 | 31 | 31 | 32 | 32 |
|---|
| Precip. | 410 | 390 | 340 | 230 | 95 | 75 | 45 | 50 | 70 | 105 | 160 | 235 |
|---|
| Prec. days | 17 | 16 | 17 | 12 | 7 | 5 | 4 | 5 | 6 | 8 | 11 | 14 |
|---|
|
|
|
| Sea temp | 29 | 29 | 29 | 29 | 28 | 27 | 26 | 26 | 26 | 27 | 28 | 28 |
|---|
| Lakeba |
|---|
|
| Jan | Feb | Mar | Apr | May | Jun | Jul | Aug | Sep | Oct | Nov | Dec |
|---|
| Min temp. | 24 | 24 | 24 | 24 | 23 | 22 | 21 | 21 | 22 | 22 | 23 | 24 |
|---|
| Max temp. | 30 | 31 | 31 | 30 | 28 | 27 | 27 | 27 | 27 | 28 | 29 | 30 |
|---|
| Precip. | 260 | 225 | 275 | 230 | 115 | 120 | 90 | 95 | 105 | 115 | 135 | 230 |
|---|
| Prec. days | 14 | 14 | 16 | 14 | 11 | 8 | 8 | 8 | 8 | 8 | 9 | 14 |
|---|
|
|
|
|
| Matei |
|---|
|
| Jan | Feb | Mar | Apr | May | Jun | Jul | Aug | Sep | Oct | Nov | Dec |
|---|
| Min temp. | 24 | 24 | 24 | 24 | 23 | 23 | 22 | 22 | 22 | 23 | 23 | 24 |
|---|
| Max temp. | 30 | 30 | 31 | 30 | 29 | 28 | 28 | 28 | 28 | 28 | 29 | 30 |
|---|
| Precip. | 340 | 255 | 260 | 265 | 175 | 140 | 90 | 105 | 145 | 200 | 195 | 330 |
|---|
| Prec. days | 18 | 17 | 17 | 17 | 13 | 11 | 10 | 10 | 11 | 14 | 14 | 18 |
|---|
|
|
|
|
| Monasavu Dam (810 meters) |
|---|
|
| Jan | Feb | Mar | Apr | May | Jun | Jul | Aug | Sep | Oct | Nov | Dec |
|---|
| Min temp. | 19 | 20 | 20 | 19 | 18 | 17 | 16 | 16 | 16 | 17 | 18 | 19 |
|---|
| Max temp. | 26 | 26 | 26 | 25 | 23 | 22 | 21 | 22 | 22 | 23 | 24 | 25 |
|---|
| Precip. | 665 | 510 | 500 | 475 | 315 | 240 | 195 | 245 | 290 | 415 | 430 | 640 |
|---|
| Prec. days | 25 | 23 | 25 | 23 | 19 | 18 | 16 | 17 | 17 | 20 | 22 | 24 |
|---|
|
|
|
|
| Nadi |
|---|
|
| Jan | Feb | Mar | Apr | May | Jun | Jul | Aug | Sep | Oct | Nov | Dec |
|---|
| Min temp. | 23 | 23 | 23 | 23 | 21 | 20 | 19 | 19 | 20 | 21 | 22 | 23 |
|---|
| Max temp. | 31 | 32 | 31 | 31 | 30 | 29 | 28 | 29 | 29 | 30 | 31 | 31 |
|---|
| Precip. | 365 | 335 | 350 | 190 | 90 | 55 | 50 | 65 | 70 | 85 | 125 | 210 |
|---|
| Prec. days | 14 | 15 | 16 | 10 | 5 | 4 | 3 | 4 | 5 | 6 | 9 | 12 |
|---|
|
|
| Sun hours | 7 | 7 | 6 | 6 | 7 | 7 | 7 | 7 | 7 | 7 | 7 | 7 |
|---|
|
| Ono-i-Lau |
|---|
|
| Jan | Feb | Mar | Apr | May | Jun | Jul | Aug | Sep | Oct | Nov | Dec |
|---|
| Min temp. | 24 | 24 | 24 | 24 | 22 | 21 | 20 | 20 | 20 | 21 | 22 | 24 |
|---|
| Max temp. | 30 | 30 | 30 | 29 | 27 | 26 | 25 | 25 | 26 | 27 | 28 | 30 |
|---|
|
|
|
|
|
| Rotuma |
|---|
|
| Jan | Feb | Mar | Apr | May | Jun | Jul | Aug | Sep | Oct | Nov | Dec |
|---|
| Min temp. | 25 | 25 | 25 | 25 | 25 | 25 | 25 | 25 | 25 | 25 | 25 | 25 |
|---|
| Max temp. | 31 | 31 | 31 | 31 | 31 | 30 | 30 | 30 | 30 | 30 | 31 | 31 |
|---|
| Precip. | 360 | 315 | 360 | 265 | 275 | 275 | 250 | 250 | 290 | 355 | 325 | 325 |
|---|
| Prec. days | 20 | 19 | 20 | 18 | 16 | 17 | 17 | 17 | 18 | 18 | 18 | 19 |
|---|
|
|
| Sun hours | 5 | 6 | 6 | 6 | 6 | 6 | 6 | 6 | 6 | 6 | 6 | 6 |
|---|
| Sea temp | 29 | 29 | 29 | 29 | 29 | 28 | 28 | 28 | 28 | 28 | 29 | 29 |
|---|
| Savusavu |
|---|
|
| Jan | Feb | Mar | Apr | May | Jun | Jul | Aug | Sep | Oct | Nov | Dec |
|---|
| Min temp. | 24 | 24 | 24 | 24 | 23 | 22 | 22 | 21 | 22 | 22 | 23 | 24 |
|---|
| Max temp. | 31 | 31 | 31 | 30 | 29 | 28 | 27 | 27 | 28 | 28 | 29 | 30 |
|---|
| Precip. | 285 | 220 | 215 | 200 | 165 | 125 | 75 | 100 | 115 | 175 | 185 | 200 |
|---|
| Prec. days | 16 | 15 | 16 | 14 | 12 | 10 | 9 | 10 | 10 | 11 | 13 | 15 |
|---|
|
|
|
|
| Suva |
|---|
|
| Jan | Feb | Mar | Apr | May | Jun | Jul | Aug | Sep | Oct | Nov | Dec |
|---|
| Min temp. | 23 | 24 | 24 | 23 | 21 | 21 | 20 | 20 | 20 | 21 | 22 | 23 |
|---|
| Max temp. | 31 | 31 | 31 | 30 | 28 | 27 | 27 | 26 | 27 | 28 | 29 | 30 |
|---|
| Precip. | 355 | 290 | 350 | 310 | 215 | 160 | 130 | 140 | 175 | 240 | 240 | 335 |
|---|
| Prec. days | 19 | 18 | 19 | 18 | 16 | 13 | 12 | 13 | 13 | 15 | 15 | 18 |
|---|
|
|
| Sun hours | 7 | 6 | 6 | 5 | 6 | 6 | 6 | 5 | 5 | 6 | 6 | 6 |
|---|
| Sea temp | 28 | 29 | 29 | 28 | 27 | 26 | 26 | 25 | 25 | 26 | 27 | 28 |
|---|
| Yasawa I Rara |
|---|
|
| Jan | Feb | Mar | Apr | May | Jun | Jul | Aug | Sep | Oct | Nov | Dec |
|---|
| Min temp. | 24 | 25 | 24 | 24 | 23 | 23 | 22 | 22 | 22 | 23 | 24 | 24 |
|---|
| Max temp. | 32 | 32 | 31 | 31 | 30 | 29 | 29 | 29 | 29 | 30 | 31 | 31 |
|---|
| Precip. | 245 | 190 | 250 | 165 | 95 | 65 | 40 | 60 | 70 | 95 | 105 | 165 |
|---|
| Prec. days | 13 | 12 | 15 | 11 | 7 | 5 | 4 | 4 | 5 | 6 | 8 | 9 |
|---|
|
|
|
|
See also the
temperatures month by month