Select units of measurement for the temperature and rainfall tables (metric or imperial).
Average weather, temperature, rainfall, sunshine
In most of Tonga, an Oceanian archipelago lying south of the Equator, there is a
tropical climate, influenced by the trade winds, with a hot, rainy season from December to April and a cool, relatively dry season from June to October. However, even in the relatively dry season, brief showers and thunderstorms may occur, which fortunately do not reduce too much the sunshine hours. Generally, the rainiest month is March.
In the northern islands, where the temperature is more stable and the rains are more abundant, we can speak of an
equatorial climate.
The
rains are abundant throughout the archipelago, but gradually decrease from north to south, from about 2,400 to about 1,600 millimeters (95 to 63 inches) per year.
The climate in detail
Niua
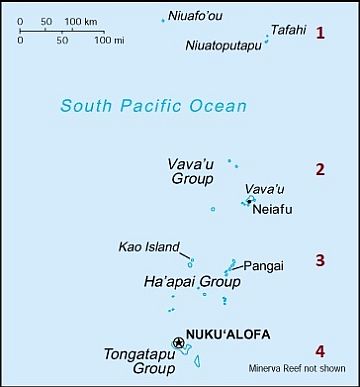
In the northernmost group of islands (zone 1 on the map), called Niua, which lie at a latitude of about 15 degrees south (Niuafo'ou, Niuatoputapu, and Tafahi), the climate is hot and humid all year round, so that, as mentioned, we can speak of
equatorial climate.

In
Niuafo'ou, between the hottest months (February and March) and the least hot months (July and August), the difference is little: highs range from 31 °C to 29.5 °C (88 °F to 85 °F).
Precipitation is abundant and exceeds 2,300 millimeters (90 inches) per year, with a rainier period from November to April, when it exceeds 200 mm (8 in) per month, two transitional months, May and October, with 170/180 mm (6.7/7.1 in) of rain per month, and a less rainy period from June to September, when still 100/140 mm (4/5.5 in) of rain fall per month.
Therefore, the best period in this area is from June to September, since it is the least rainy, and albeit slightly, the least hot. The sea is warm all year round.
Vava'u
Further south, in
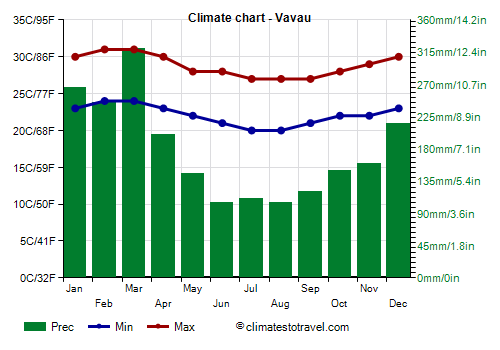
Vava'u and the surrounding islets (2 on the map), at nearly 19 degrees south latitude, the temperature in the coolest months drops a bit: highs in July, August, and September are around 27 °C (81 °F), in addition, cool air masses can sometimes lower the night temperature to around 15 °C (59 °F) and the maximum around 25 °C (77 °F).
In this group, precipitation is also less abundant, and amounts to 2,100 mm (83 in) per year.
Here, as in the northernmost islands,
sea is warm enough to swim in all year round, although the water temperature drops to 25.5 °C (78 °F) from July to September.
In this group too, since it is almost always warm enough for a beach holiday, the best period is from June to September.
Ha'apai
More to the south, at 19/20 degrees south latitude, we find the
Ha'apai group (3 on the map), made up of islands such as Lifuka, Foa, and Ha'ano. Here, the temperatures are about a degree Celsius lower, moreover, rainfall drops to around 1,600 mm (63 in) per year, at least on the flat islands, while there are also volcanic islands, such as Kao, with inland slopes that enhance the formation of thunderstorm clouds.
Lifuka
Highs in
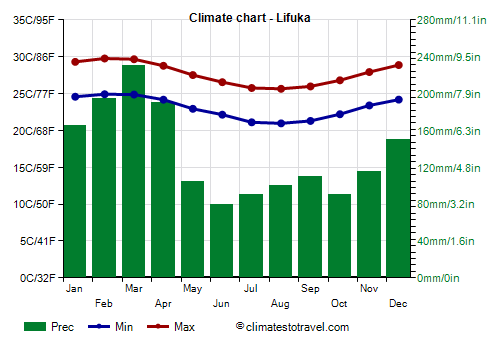
Lifuka range from 30 °C (86 °F) in February and March to 26 °C (79 °F) between July and September.
Here too, from May to October, cool air can sometimes arrive and lower the temperature to around 15 °C (59 °F) at night and, especially from July to September, to 22/23 °C (72/73 °F) during the day.
In Lifuka, there is no real dry season, but the rains are at an acceptable level from May to November.
In the central part too, the
sea is warm enough all year round, in fact the water temperature drops to 24.5/25 °C (76/77 °F) from July to September.
Being that the relatively dry season is a little longer, the best time here is from May to October.
Far south
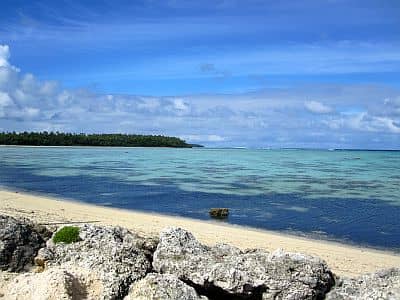
In the far south, we finally find the groups of
Tongatapu and
'Eua (4 on the map).
Tongatapu
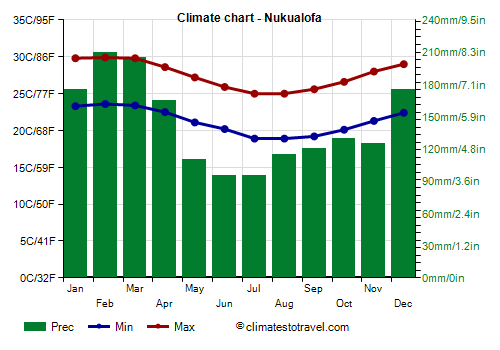
In Tongatapu, where
Nuku'alofa, the capital, is located, owing to the more southern position (the group is located at a latitude of 21 degrees south), winter is a quite cool season: highs from June to September are around to 25/26 °C (77/79 °F). Also,
cold air masses can sometimes arrive, lowering the temperature to 12/13 °C (53/55 °F). At the Fua'amotu International Airport, the temperature dropped to 8.7 °C (47.7 °F) in September 1994.
In these southern islands, precipitation is still around 1,600/1,700 mm (63/67 in) per year.
On the southernmost islands, the
sea temperature also decreases by a few degrees in the southern winter, dropping to 23.5 °C (74 °F) in August and September, so it remains acceptable but not so warm.
It is true that the minimum temperature remains generally high, around 19/20 °C (66/68 °F), so the conditions remain usually acceptable for a beach holiday, but those who are sensitive to cold could feel a bit cool, also because, as we have said, sometimes there can be very cool periods, especially from July to September. So, on these southernmost islands of Tonga, you can choose the months of May, October, and November, when temperatures are a little higher.
Tropical cyclones
The islands of Tonga are in the path of
tropical cyclones. Cyclones are usually formed from November to mid-May, though they are most likely from late December to early April.
The following are some intense cyclones that hit the Tongan archipelago in the past few decades: Ron in January 1998, Waka in December 2001, Heta in January 2004, and Gita in February 2018.
When to go
The best time to travel to Tonga is:
- from
June to September on the northern islands, down to the Vava'u group inclusive,
- from
May to October in the Ha'apai group,
- and finally, it corresponds to the months of
May, October and November in the southern group of Tongatapu.
Anyway, considering that, albeit rarely,
cyclones may also occur in November and in the first half of May, for safety, you can exclude these periods, even where they fall within the best ones.
What to pack
For the
northernmost islands, all year round, bring tropics-friendly, loose-fitting clothing, a sun hat, a scarf for the breeze, a light sweatshirt for the evening, and a light raincoat or umbrella.
For the
central and southern islands:
In
winter (June to August), pack light clothes for the day, a scarf for the breeze, a sweatshirt for the evening, and possibly a light jacket for the southern islands; a light raincoat or umbrella. When going to the reef, you can bring snorkeling equipment, including water shoes or rubber-soled shoes.
In
summer (December to February), pack tropics-friendly, loose-fitting clothing, a sun hat, a scarf for the breeze, a light sweatshirt for the evening, and a light raincoat or umbrella.
Climate data - Tonga
| Lifuka |
|---|
|
| Jan | Feb | Mar | Apr | May | Jun | Jul | Aug | Sep | Oct | Nov | Dec |
|---|
| Min temp. | 25 | 25 | 25 | 24 | 23 | 22 | 21 | 21 | 21 | 22 | 23 | 24 |
|---|
| Max temp. | 29 | 30 | 30 | 29 | 28 | 27 | 26 | 26 | 26 | 27 | 28 | 29 |
|---|
| Precip. | 165 | 195 | 230 | 190 | 105 | 80 | 90 | 100 | 110 | 90 | 115 | 150 |
|---|
| Prec. days | 13 | 15 | 17 | 14 | 12 | 11 | 12 | 11 | 10 | 11 | 9 | 13 |
|---|
|
|
|
| Sea temp | 28 | 28 | 28 | 28 | 27 | 26 | 25 | 25 | 25 | 25 | 26 | 27 |
|---|
| Niuafoou |
|---|
|
| Jan | Feb | Mar | Apr | May | Jun | Jul | Aug | Sep | Oct | Nov | Dec |
|---|
| Min temp. | 24 | 24 | 24 | 24 | 24 | 24 | 24 | 23 | 23 | 24 | 24 | 24 |
|---|
| Max temp. | 31 | 31 | 31 | 31 | 30 | 30 | 30 | 30 | 30 | 30 | 31 | 30 |
|---|
| Precip. | 305 | 250 | 305 | 250 | 165 | 110 | 135 | 115 | 145 | 175 | 230 | 270 |
|---|
| Prec. days | 21 | 18 | 22 | 17 | 16 | 13 | 14 | 14 | 12 | 15 | 18 | 21 |
|---|
|
|
|
| Sea temp | 29 | 29 | 29 | 29 | 28 | 27 | 26 | 26 | 26 | 27 | 28 | 28 |
|---|
| Nukualofa |
|---|
|
| Jan | Feb | Mar | Apr | May | Jun | Jul | Aug | Sep | Oct | Nov | Dec |
|---|
| Min temp. | 23 | 24 | 23 | 22 | 21 | 20 | 19 | 19 | 19 | 20 | 21 | 22 |
|---|
| Max temp. | 30 | 30 | 30 | 29 | 27 | 26 | 25 | 25 | 26 | 27 | 28 | 29 |
|---|
| Precip. | 175 | 210 | 205 | 165 | 110 | 95 | 95 | 115 | 120 | 130 | 125 | 175 |
|---|
| Prec. days | 17 | 19 | 19 | 17 | 15 | 14 | 15 | 13 | 13 | 11 | 12 | 15 |
|---|
|
|
|
| Sea temp | 27 | 28 | 28 | 27 | 26 | 25 | 24 | 24 | 24 | 24 | 25 | 26 |
|---|
| Vavau |
|---|
|
| Jan | Feb | Mar | Apr | May | Jun | Jul | Aug | Sep | Oct | Nov | Dec |
|---|
| Min temp. | 24 | 25 | 24 | 24 | 22 | 22 | 21 | 21 | 21 | 22 | 23 | 24 |
|---|
| Max temp. | 29 | 30 | 29 | 28 | 28 | 27 | 26 | 26 | 26 | 27 | 28 | 29 |
|---|
| Precip. | 265 | 245 | 320 | 200 | 145 | 105 | 110 | 105 | 120 | 150 | 160 | 215 |
|---|
| Prec. days | 19 | 20 | 21 | 18 | 15 | 15 | 16 | 14 | 13 | 14 | 14 | 19 |
|---|
|
|
|
| Sea temp | 28 | 28 | 29 | 28 | 27 | 26 | 26 | 25 | 26 | 26 | 27 | 28 |
|---|
See also the
temperatures month by month