Select units of measurement for the temperature and rainfall tables (metric or imperial).
Average weather, temperature, rainfall, sunshine
The climate of the Cook Islands, an archipelago in the Pacific Ocean located south of the Equator, "free association" with New Zealand, is
tropical, with a rainy period from December to March and a relatively dry period from June to September, without there being a real dry season.
Rainfall is abundant throughout the country: on the northern islands, it ranges from 1,900 to 2,800 millimeters (75 to 110 inches) per year, becoming progressively more abundant from east to west, while on the southern islands, it hovers around 2,000 mm (80 in) per year.
The
amount of sunshine on the Cook Islands is fairly uniform throughout the year, which means that even in the rainiest months, there is a fair amount of sunshine hours: showers are more intense and more frequent, but they do not last long and do not shield too much the sun, even in this period.

The climate in detail
North

The islands are divided into two groups: the
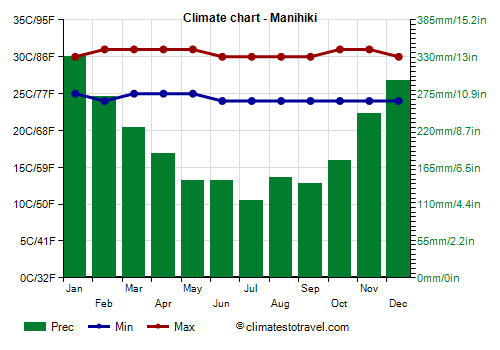
northern islands, closer to the Equator (8 to 13 degrees south latitude), are warmer and have a stable temperature, around 27/28 °C (81/82 °F) as daily average throughout the year.
The main islands are Manihiki, Nassau, Penrhyn, Pukapuka, Rakahanga and Suwarrow.
As mentioned, precipitation in the northern islands
decreases from west to east. The reason lies in the fact that the easternmost islands are closer to the arid zone of the Kiribati archipelago. Unlike in Kiribati, the rains on the Cook Islands are still plentiful, but during
La Niña years, when the cool easterly winds that blow near the Equator from South America become more intense, the dry area becomes wider and reaches the Cook Islands. On the other hand, in
El Niño years, when the cool winds slow down, the sea warms up, and the frequency of cyclones increases.
On
Manihiki island, rainfall amounts to 2,400 mm (95 in) per year, with a maximum in January and a minimum in July.
In the north, the
sea temperature is high all year long, around 28/29 °C (82/84).
South
On the contrary, on the
southern islands, from 18 to 21 degrees south latitude, there is
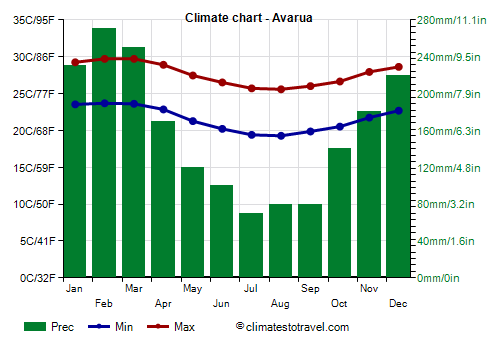
a cooler period from June to October, when the daily average drops to around 22/23 °C (72/73 °F), while in the warmest period, from January to April, it doesn't go above 26/27 °C (79/81 °F).
The southern islands are Aitutaki, Atiu, Mangaia, Manuae, Mauke, Mitiaro, Palmerston, Rarotonga and Takutea.

At the acme of the cool period, the maximum temperatures drop to around 25 °C (77 °F) on the southernmost islands of Rarotonga and Mangaia, and around 27 °C (81 °F) in Palmerston and Aitutaki.
From May to October, but especially from July to September,
cool air can arrive from the south, which can lower the temperature to 14/15 °C (57/59 °F) at night and 23/24 °C (73/75 °F) during the day, especially in Rarotonga and Mangaia.
In the capital,
Avarua, located on the island of Rarotonga, more than 200 mm (8 in) of rain fall per month from December to February, the wettest period, and about 70/100 mm (2.8/3.9 in) from June to September, the driest period.
On the southern islands, the
sea temperature also decreases a bit in the winter months, given that it drops to 24/24.5 °C (75/76 °F) from July to October, although it remains high enough for swimming.
Tropical cyclones
The Cook Islands are situated in the area of the
tropical cyclones of the South Pacific, which may pass over the islands from November to April (although they are more likely from December to March).
The northern islands are located right in the area where cyclones form, so they are usually still in the early stages of their life, and then evolve migrating south, although it is possible that some of them could grow rapidly, becoming intense in the same area where it has just formed.
An intense cyclone, formed a little earlier than in the normal period, was Martin, which hit the islands at the end of October 1997. Another intense cyclone was Percy, which affected the islands from late February to early March 2005.
When to go
The best time to visit the Cook Islands runs
from mid-May to mid-October on the northern islands, where it's hot and muggy, but tempered by the trade winds; downpours can sometimes be intense, but they do not last long, so the sun will shine again soon.
As regards to the southern islands, the best time is more or less the same, from mid-May to mid-October, but you will find lower temperatures, less abundant rains (though still possible), and the trade winds, which may sometimes be a bit cool for those who are sensitive to cold. It will therefore be useful to bring a sweater or a sweatshirt for the evening.
What to pack
In
winter (June to August), bring light clothes for the day, a scarf for the breeze, a sweatshirt for the evening, possibly a light jacket for the southern islands, and a light raincoat or umbrella.
In
summer (December to February), bring light clothes of natural fibers, a sun hat, a scarf for the breeze, a light sweatshirt for the evening, and a light raincoat or umbrella.
Climate data - Cook Islands
| Avarua |
|---|
|
| Jan | Feb | Mar | Apr | May | Jun | Jul | Aug | Sep | Oct | Nov | Dec |
|---|
| Min temp. | 24 | 24 | 24 | 23 | 21 | 20 | 19 | 19 | 20 | 21 | 22 | 23 |
|---|
| Max temp. | 29 | 30 | 30 | 29 | 27 | 27 | 26 | 26 | 26 | 27 | 28 | 29 |
|---|
| Precip. | 230 | 270 | 250 | 170 | 120 | 100 | 70 | 80 | 80 | 140 | 180 | 220 |
|---|
| Prec. days | 15 | 16 | 15 | 13 | 12 | 10 | 8 | 8 | 8 | 12 | 14 | 14 |
|---|
|
|
|
| Sea temp | 27 | 28 | 28 | 27 | 26 | 25 | 24 | 24 | 24 | 24 | 25 | 26 |
|---|
| Manihiki |
|---|
|
| Jan | Feb | Mar | Apr | May | Jun | Jul | Aug | Sep | Oct | Nov | Dec |
|---|
| Min temp. | 25 | 24 | 25 | 25 | 25 | 24 | 24 | 24 | 24 | 24 | 24 | 24 |
|---|
| Max temp. | 30 | 31 | 31 | 31 | 31 | 30 | 30 | 30 | 30 | 31 | 31 | 30 |
|---|
| Precip. | 330 | 270 | 225 | 185 | 145 | 145 | 115 | 150 | 140 | 175 | 245 | 295 |
|---|
| Prec. days | 21 | 17 | 14 | 13 | 11 | 11 | 9 | 10 | 10 | 12 | 15 | 18 |
|---|
|
|
|
| Sea temp | 29 | 29 | 29 | 29 | 29 | 29 | 28 | 28 | 28 | 29 | 29 | 29 |
|---|