In much of European Russia, the climate is
continental, with very cold winters, during which the temperature is often below freezing, and warm summers. The northernmost regions, however, have an
arctic or subarctic climate. Instead, on the Black Sea coast, there is a stretch that has an almost
Mediterranean climate and is the only mild area.
Precipitation is generally not abundant. In the arctic regions it is weak but frequent, often occurring in the form of snow. In the southeast, the Caspian Sea area is semi-desert. Instead, in the main cities, located in the central belt (see Moscow, St. Petersburg), precipitation is moderate, around 700 millimeters (27.5 in) per year.
The European part of Russia, the one located to the west of the Ural Mountains, is not as cold as the Asian one, yet the lowest temperatures of the European continent are recorded here.
Proceeding from west to east, there is typically an increase in
continentality (especially with regard to the winter cold) and a decrease in precipitation.
Owing to the absence of major mountain ranges (excluding the Caucasus in the south), this country is exposed to different influences, warm and cold, so the climate is characterized by a
chronic instability.
The
influence of Atlantic air masses is not remarkable, though they can sometimes bring mild and wet weather. From the Arctic Ocean, the blizzard is able to bring snow storms in winter; from Siberia, frigid air masses in winter may arrive, while from Central Asia, in summer warm winds can blow, called
Sukhoviei.
Index
The north

![]() Climate chart - Hayes
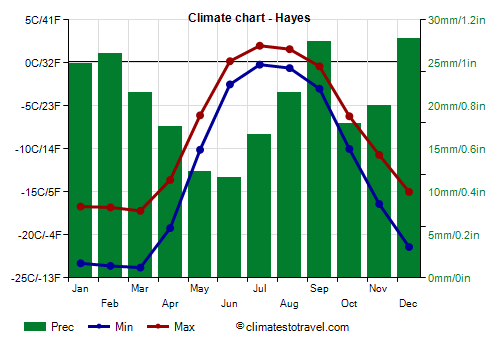
Climate chart - Hayes
On the northernmost islands of Russia (see
Franz Josef Land), at 80 degrees north latitude, the climate is
Arctic, with an average temperature in the coldest months (which at high latitudes are February and March) around -20 °C (-4 °F), so it is colder than in the Svalbard Islands (which belong to Norway), while the average in the warmest month (July) is around 1 °C (34 °F).
Precipitation is scarce, around 250 millimeters (10 inches) per year. The sun shines rarely, about 1,000 hours a year, with a maximum from April to June. Given the latitude, the sun is always below the horizon from late October to late February, while it never sets from mid-April to the end of August.
On
Hayes Island (also called Heiss,
Ostrov Kheysa in Russian) belonging to the archipelago of Franz Josef Land, the temperature can even drop below -40 °C (-40 °F), although the last time it reached this value was in January 1997.
![]() Climate chart - Malye Karmakuly
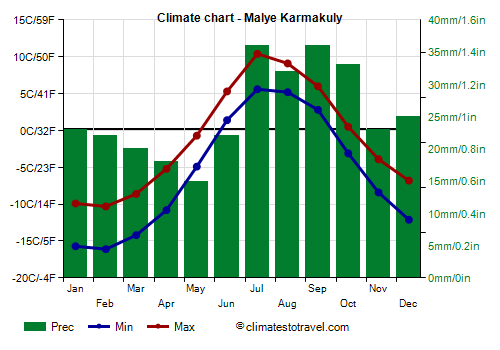
Climate chart - Malye Karmakuly
South of Franz Josef Land, on the islands of
Novaya Zemlya, which separates the Barents Sea from the Kara Sea, the climate is Arctic in the northern tip, where the average in July is still around 1 °C (34 °F), while it becomes progressively milder as you move south. In inland areas, especially on the northern island, there are hills, where perennial snows are found already at a few hundred meters above sea level.
In
Malye Karmakuly, in the south-central area, at 72 degrees north latitude, the climate is subarctic, with about 4 months above freezing (0 °C or 32 °F), namely from June to September. On average, 335 mm (13 in) of rain, and especially snow, fall per year.

After the Arctic islands, let's now talk about the
northern coasts of mainland Russia, which border the Barents Sea. Here, the climate is
subarctic, with a long, cold winter and a cold summer, which lasts three to four months.
The Barents Sea remains ice-free even in winter because the last branch of the Gulf Stream arrives here. The average temperatures in winter are around -5 °C (23 °F) in the western part of the Kola Peninsula and decrease progressively towards the east, until they drop to about -20 °C (-4 °F) in the eastern part (see Amderma).
As we have said, along these coasts the summer is cold, with average daily temperatures rising a few degrees above freezing in the warmest months, during which highs are around 10/12 °C (50/54 °F).
More to the south, at a certain distance from the sea or along the shores of bays and sheltered inlets, there is a large area where the climate is
cold continental, with a long, cold winter (often colder than in the previous area because of the stronger continentality) and a cool or mild summer, when the maximum temperatures are close to 20 °C (68 °F).
![]() Climate chart - Murmansk
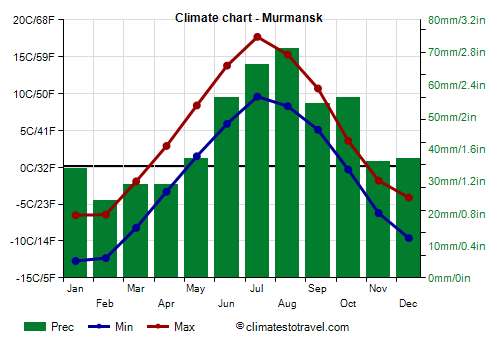
Climate chart - Murmansk
For example, in
Murmansk, in a fjord on the Kola Peninsula, the average temperature in January is -9.5 °C (15 °F), while in summer the temperature is steadily above freezing for about 5 months and a half, from May to mid-October, and the average maximum in July is around 17 °C (63 °F). The coldest record is -39.3 °C (-38.7 °F) and was set in January 1985. In summer, the temperature can sometimes reach 30 °C (86 °F) for short periods. In July 2018, it reached 32.2 °C (90 °F).
Precipitation in Murmansk, not abundant, amounts to 530 mm (21 in) per year, with a minimum in winter and spring, when light snowfalls occur, and a summer maximum.
In Murmansk, the sun is practically absent in winter, also because of the very short days (from December 1st to January 10th, the sun does not even rise), while it has the chance to appear among the clouds for a few hours per day in spring and in summer (also because the days are very long, and from May 22nd to July 22nd the sun does not even set).

Being sheltered from the Gulf Stream, the
White Sea freezes during winter; along the coasts, in cities like Archangel and Onega, the average daily temperature in January are around -12 °C (10 °F), while in summer the maximum temperature reaches on average 20/22 °C (68/72 °F).
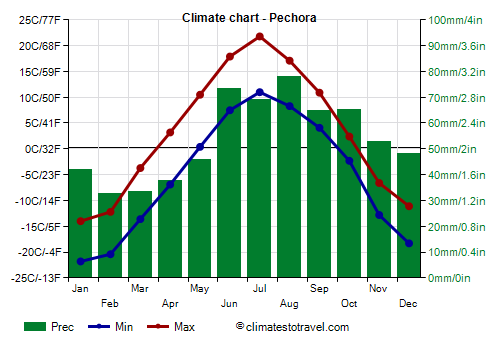
Further east, in the vast plains of the Arkhangelsk Oblast and of the Komi Republic, there are areas where the lowest temperatures of the European continent have been recorded: -52 °C (-61.5 °F) in Vorkuta (in 1978), and -56 °C (-69 °F) in Pechora (in 1946).
![]() Climate chart - Pechora
Climate chart - Pechora
In
Pechora, located at a latitude of 65 degrees north, about 380 km (240 miles) south of the Arctic coast, the average temperature in January is -18 °C (-0.5 °F). In July, the average maximum is around 22 °C (72 °F), with short periods above 30 °C (86 °F). In July 2020, the temperature reached 35 °C (95 °F).
Precipitation is around 650 millimeters (25 inches) per year, and summer is the rainiest season (winter is too cold to have substantial precipitation, which is weak but frequent, in the form of light snow, for many months).
The big cities

Further south, we enter a
wide flat area that includes Moscow, St. Petersburg and the major cities of European Russia. This area has a
continental climate, though the temperature remains below freezing for a shorter period than in the north. Summer is warm, and precipitation is frequent throughout the year, though with a summer maximum.
In this vast area, the climate becomes
progressively more continental as you move towards the east, mainly because of the colder winter; for instance, in Ufa, more than 1,000 kilometers (600 miles) east of Moscow, the average in January is -12 °C (10 °F), so it's a few degrees lower than in the capital (see below), while the summer it's slightly warmer.
In the great Russian plains, in the past the
winter was colder: the average temperature in recent decades has increased by a few degrees, and cold waves from Siberia have become more rare.
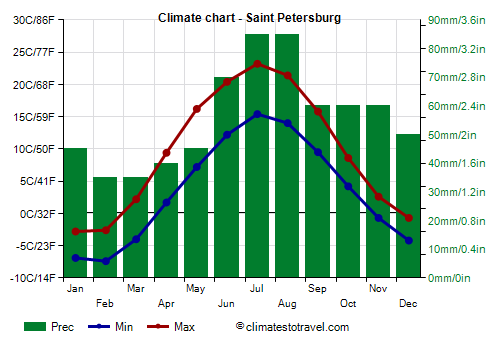
![]() Climate chart - Saint Petersburg
Climate chart - Saint Petersburg
In
St. Petersburg, the influence of the sea is not remarkable because the Gulf of Finland during winter is often frozen. In fact, winter is freezing: the average in February is -5 °C (23 °F), a bit higher than in Moscow.
On the contrary, in the other seasons, the maritime influence is evident, in fact the summer is mild, with highs around 21/23 °C (70/73 °F), and also humid and rainy. August is usually rainier than July. Occasionally, however, warm air masses from the continental area can arrive here as well (which is reminiscent of the hot and muggy St. Petersburg described by Dostoevsky).
In St. Petersburg, precipitation is not abundant during the long winter months, when it often occurs in the form of light but frequent snowfall, while it is more abundant in summer.
The sea near Saint Petersburg is cold all year round, and as mentioned in winter it can freeze (seawater freezes at about -2 °C or 28.5 °F).


![]() Climate chart - Moscow
Climate chart - Moscow
In
Moscow, the capital, the average January temperature of the last 30 years is -7 °C (19 °F); the average daily temperature remains below freezing from November to March. Summer is warm, with a July average of 19 °C (66 °F), but sometimes it can get hot. In summer, there is a moderate amount of rainy days, while in periods of good weather, thunderstorms can break out in the afternoon.

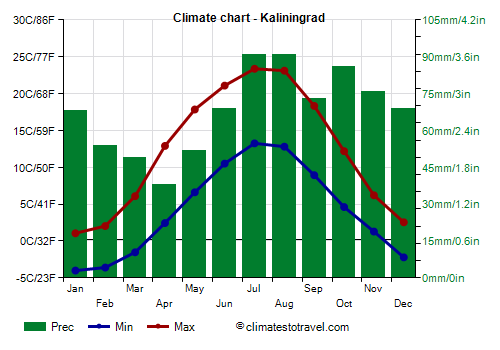
![]() Climate chart - Kaliningrad
Climate chart - Kaliningrad
Outside of the main territory, in the west, between Poland and Lithuania, we find the small exclave of
Kaliningrad (formerly Königsberg). Here, the climate is Baltic semi-continental, with cold winters, though less cold than in Moscow and St. Petersburg, and mild summers.
In February 1956, the temperature dropped to -33.3 °C (-28 °F), while in this century it dropped to -28 °C (-18.5 °F) in January 2003 and February 2012. Instead, in summer it reached 36 °C (97 °F) on some occasions (February 1992, July 1994 and August 2014).
Precipitation amounts to 800 mm (31.5 in) per year, with a minimum in spring and a maximum in summer and autumn.
The
sun in Kaliningrad is rarely seen from November to February, while from May to August it shines for a decent number of hours (the days are very long, so the total amount of sunshine is not low).
The Baltic Sea is very cool even in summer, however, the water temperature reaches 18 °C (64 °F) in August.

The south

In the
southern region of Russia, in the plains between Ukraine and Kazakhstan, winters are still cold but shorter, while summers are hot. Owing to the scarcity of precipitation, in this area we find the
steppe.
Already in
Volgograd, where the average temperature in January is -6 °C (21 °F), in summer highs are normally around 29/30 °C (84/86 °F), but sometimes they can reach 40 °C (104 °F); annual precipitation amounts to only 350 millimeters (13.8 inches).
The only part of European Russia where the daily average in January exceeds freezing is the coast of the
Black Sea. It should be noted, however, that in this area the winter is not mild everywhere: it's still cold in the Sea of Azov, where the average temperature in January is -0.5 °C (31 °F), while along the coast of the Black Sea it gradually increases, from 3 °C (37.5 °F) in Anapa, to 7 °C (44.5 °F) in
Sochi, which is protected by the Caucasus mountains.
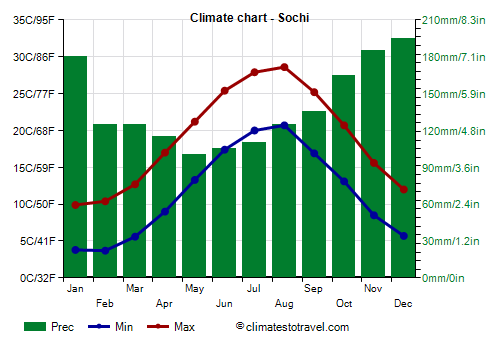
![]() Climate chart - Sochi
Climate chart - Sochi
So, the only really mild area is that of Sochi, and in fact this was the winter holiday resort for the members of the Soviet
nomenklatura. The average temperature in January and February is 7 °C (44.5 °F). To the north there are mountains that partly protect this area from the cold wind, which often blows as a warm, down-slope wind. However, even here there can be cold spells, with snowfalls and frosts. In January 1997 the temperature dropped to -11 °C (12 °F).
In summer, the temperature is high: the average in July and August is around 24/24.5 °C (75/76 °F).
On the other hand, in this area
it rains a lot all year round, even in summer, when showers and thunderstorms can occur in the afternoon. On the northern coast of the Black Sea, in Anapa, it rains less, and in summer only 30/40 mm (1.2/1.6 in) fall per month, compared with more than 100 mm (4 in) per month in Sochi.
Sochi receives 2,175 hours of sunshine a year. The amount of sunshine is better than in the rest of Russia, but it does not reach the levels of the Mediterranean cities, where more than 2,500 hours of sunshine per year are often recorded.
The sea temperature in Sochi is warm enough for swimming in summer, especially in July and August, when it reaches 24/25 °C (75/77 °F).

In the
Caspian Sea, the situation is quite different, and the climate is not so mild. Along the northern coast, the climate is semi-desert, with hot summers, when the daily average in July and August is around 24/25 °C (75/77 °F), and cold winters, with a January average of -3.5 °C (26 °F) in Astrakhan and -2 °C (28 °F) in Lagan' (formerly Kaspiyskiy). More to the south, along the coast of Dagestan, winter is progressively less cold and a little less arid, in fact the average in January reaches 2 °C (35.5 °F) in the southernmost part of Dagestan, near the border with Azerbaijan, more or less in the middle of the Caspian Sea (see Derbent).
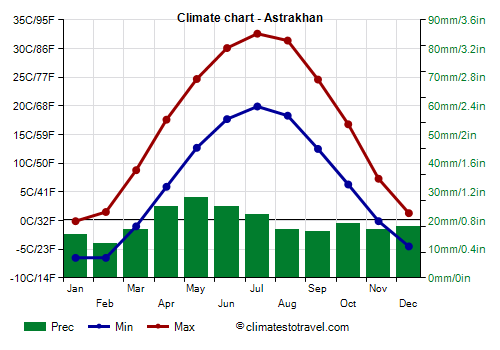
![]() Climate chart - Astrakhan
Astrahan
Climate chart - Astrakhan
Astrahan is located at 46 degrees north latitude, on the banks of the Volga River, near the northern coast of the Caspian Sea. Although the average winter temperature is a little higher than in the central-north, sometimes there can be intense cold spells. In February 2012, the temperature dropped to -33.6 °C. In summer, on the other hand, it can reach 40 °C (104 °F).
In Astrahan, precipitation amounts to only 230 mm (9 in).
The amount of sunshine is very good in late spring and summer, while in winter the sun does not shine often.

In winter, the Caspian Sea in the Russian side is colder than the Black Sea, while in summer it becomes equally warm.
Between the two seas (the Caspian Sea is actually a huge salt lake), we find the aforementioned
Caucasus Mountains, among which Mount
Elbrus stands out with its 5,642 meters (18,510 feet).
Here the climate varies with altitude and slope exposure, so it is cold and snowy at high altitudes, while at low altitudes, at the foot of the mountains, it is continental with cold winters. On the contrary, summers are warm or hot.
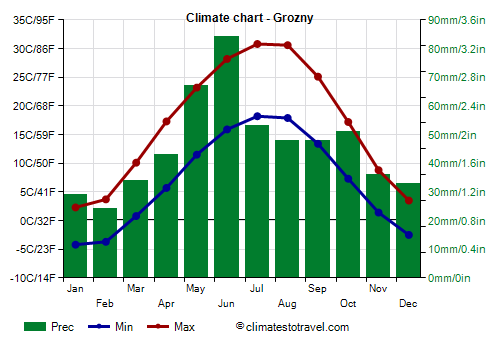
![]() Climate chart - Grozny
Climate chart - Grozny
In
Grozny the average temperature ranges from -1 °C (30 °F) in January to 24.5 °C (76 °F) in July.
The western part of the Caucasus is more rainy (and more snowy in winter) than the eastern one. Precipitation in Grozny is not abundant, since it amounts to 550 mm (21.5 in) per year, and it's scarce in winter and relatively more abundant in late spring and summer.

When to go
The best time to visit most of European Russia is generally the
summer (late May to early September in Moscow and St. Petersburg, and only July and August in the northernmost areas), which allows to avoid the discomfort of cold and bad weather. On the other hand, in the southern regions (the Caspian Sea, the steppe areas, the foothills of the Caucasus), where the summer is hot, you may prefer
May and September.
In
St. Petersburg, even in summer there can be cool and rainy days; in June, here as in other areas located at high latitude, you can enjoy the famous white nights (when it never becomes completely dark).
In
Moscow, where in winter the temperature can drop to -30 °C (-22 °F) and below, summer can sometimes be hot, with highs about 30 °C (86 °F) and even above; in the afternoon, there may be some thunderstorms, while sometimes days can be cool even in mid-summer, with maximum temperatures below 20 °C (68 °F).
The
worst time in Russia is probably the thaw: unpaved roads are often impassable because of the mud caused by the melting snow. Depending on the area and the year, this phenomenon, called
rasputitsa, occurs in different periods. In the Arctic, it occurs in summer, while in Moscow it usually occurs in late March or early April, and it lasts about a fortnight. The Russians prefer the winter frost to these cold and wet periods.
If you intend to visit Russia in its
winter appearance, in the second half of February the days are longer and temperatures is often less cold, though still below freezing.
What to pack
In
winter: it's necessary to bring cold weather clothing such as synthetic thermal long underwear, a fleece, a parka, a wind jacket, warm boots. For Sochi and the Black Sea: bring warm clothes, such as a sweater, a jacket, a raincoat or umbrella.
In
summer: in Moscow and St. Petersburg, bring spring/autumn clothes, T-shirts and shorts for hot days, but also a jacket and a sweater for the evening and for cooler days; a raincoat or umbrella.
On the Arctic coasts and islands: bring warm clothes, such as a down jacket, a hat, gloves.
In the south, the coast of the Caspian Sea and the Black Sea: bring light clothing, a sweatshirt or a light jacket for the evening.
Back to topSee also the
temperatures month by month