Select units of measurement for the temperature and rainfall tables (metric or imperial).
Average weather, temperature, rainfall, sunshine
In much of Ukraine, the climate is
continental, with cold winters and warm summers, which become progressively warmer as you move towards the south. To the south, the Black Sea coast experiences slightly milder weather in winter, with January and February averages around freezing. Only on the southern coast of the Crimean Peninsula (see Yalta) is winter mild enough, so much so that the climate is
almost Mediterranean.
Precipitation (rain or snow) is quite frequent throughout the year, but it's not abundant in most of the country, since it hovers between 500 and 600 millimeters (20 and 23.5 inches) per year in the vast inland area occupied by plains and hills.
The rainiest season is summer because of afternoon thunderstorms. However, winter is not dry, since precipitation in this season is not abundant but it's quite frequent, and often occurs in the form of light snow.
In the Black Sea region, precipitation is even scarcer, below 500 mm (20 in) per year, since summer thunderstorms occur more rarely. The only area that is quite rainy is the western one, Galicia (see Lviv), where more than 700 mm (27.5 in) of rain fall per year, and the Carpathian Mountains, where precipitation reaches 1,200 mm (47 in) per year, in addition to the small area of the Crimean Mountains, where it can reach 1,000 mm (40 in). To the west of the Carpathians, there is another flat area, though small, where precipitation exceeds 700 mm (27.5 in) per year.
The
sun in Ukraine rarely shines in winter, especially in inland areas, where gray skies prevail, while it often shines in summer, especially along the shores of the Black Sea. On average, there are about 1,850 hours of sunshine per year in the north and 2,250 in the south.
The climate in detail
The seasons
Winter is cold in much of Ukraine: the average temperatures are below freezing (0 °C or 32 °F) in inland areas and around freezing on the coast, while they exceed this value in Crimea. Snow covers Kyiv for about 80 days per year (which were about one hundred in the previous decades, when the climate was colder).
The
coldest periods are those in which the Siberian Anticyclone settles in the country: in these situations, the temperature can drop to -20 °C (-4 °F) or even below. The cold records are around -30/-35 °C (-22/-31 °F) in inland areas and around -25/-28 °C (-13/-18 °F) on the coast.
During the coldest periods the sea can freeze, sometimes in the Odesa Bay, more often in the Sea of Azov, which is shallow and closed by the Crimea, and only during the coldest winters, as in February 2012, also in Crimea.
The average winter temperature has increased by a few degrees over the last few decades, especially in the interior. Anyway, periods of severe cold are still possible, although, in comparison with the past, they are less frequent and tend to be shorter.
Spring is an
unstable season, in fact, both the temperature and the sunshine hours grow rapidly, however, cold weather can return. In continental areas, the
thaw generally occurs in late February, but during some years also in March; the snow turning into mud can make it difficult to travel on rural roads.
In March, during some years, the temperature can drop to -10 °C (14 °F), and sometimes even -15 °C (5 °F), in inland areas.
Even in April, especially in the first half of the month, the temperature can drop below freezing and it can snow.
By May, the temperatures generally start to become pleasant, but it can still get cold at night, especially in the first half of the month.
Summer in Ukraine is warm and quite sunny, with possible thunderstorms, which are more likely in the center-north.
Maximum temperatures in July are around 25/26 °C (77/79 °F) in the north (see Chernihiv, Kyiv) and around 28/29 °C (82/84 °F) in the south (see Dnipro) and on the coast of the Black Sea (see Odesa).
The summer on the Black Sea Coast, especially in Crimea, is similar to that of the northern coast of the Mediterranean (French Riviera, Liguria), although the rains are a bit more frequent, around 5/6 days per month.
In summer, the inland regions are sometimes affected by disturbances of Atlantic origin or by cool air masses from the north, so their average temperature is lower than in the regions overlooking the sea. However, the interior is also subject to
heat waves, which last a few days and can raise the temperature to 35 °C (95 °F) or more.
In
autumn, the temperature decreases rapidly. September is still a pleasant month in the Black Sea area, with highs around 22/23 °C (72/73 °F), while the north it's already cool, with highs around 19/20 °C (66/68 °F). Sometimes, it can get cold, with the first snowfalls, already in October, however, the turning point occurs in November, when it starts to get cold across the country, and the sunshine becomes scarce as well.
Autumn in Ukraine is not a very rainy season.
Inland areas
Kyiv
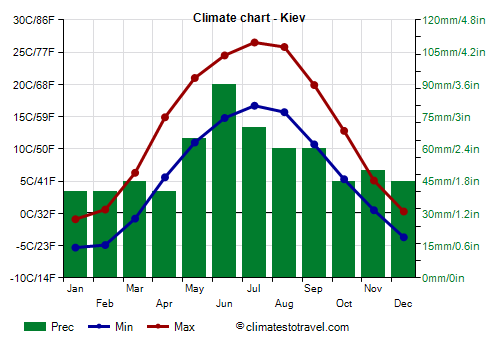
In
Kyiv (or Kiev), the capital, located in the north of the country, the average temperature ranges from -3 °C (26.5 °F) in January to 21.5 °C (70.5 °F) in July.
Precipitation amounts to 640 mm (25 in) per year. The wettest season is summer.
The sun in Kyiv is rarely seen from November to February, while in summer, it shines quite often.
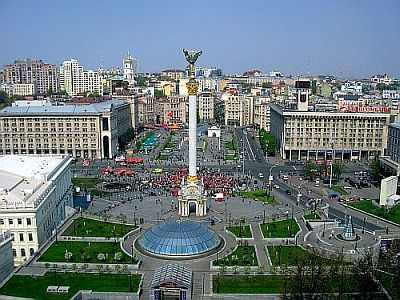
Lviv
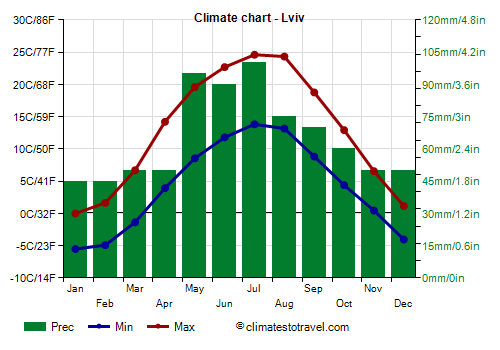
In the north-west, in
Lviv, the climate is a bit less warm in the summer, since it is located at 300 meters (1,000 feet) above sea level.
Furthermore, precipitation is higher, around 770 mm (30 in) per year.
Dnipro
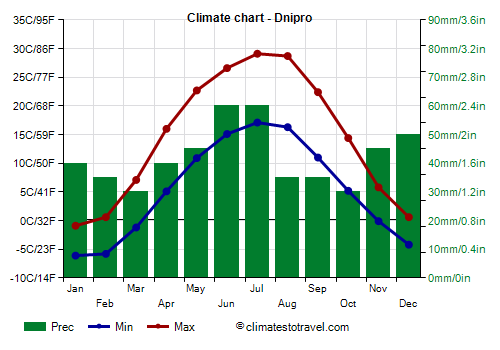
In the center-south, in
Dnipro (formerly Dnipropetrovsk), the summer is instead a little warmer than in Kyiv, so much so that the maximum temperatures in July reach 29 °C (84 °F).
In Dnipro, 505 mm (20 in) of rain or snow fall per year.
The coast
Odesa
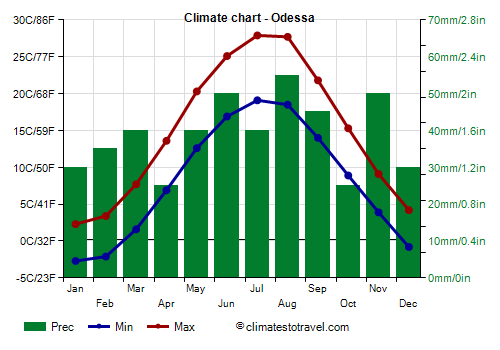
The coast of the
Black Sea is not so mild in winter. In
Odesa, the average temperature in January is 0 °C (31.5 °F), there are on average 40 days with snowfall, and the cold record of the past 20 years is -22 °C (-7.5 °F). However, summer is warm to hot and sunny, with some thunderstorms.
In Odesa, just 470 mm (18.5 in) of rain fall per year.
In Odesa, the winter sky is often gray, while the summer is sunny.
The Black Sea, cold in winter, becomes acceptable for swimming in July and August, while it is a bit cool in June and September. In the east, the Sea of Azov, more closed and sheltered, is a bit warmer in summer.
Crimea
In Crimea (which was annexed to Russia in 2014), winter is not as cold as in Odesa. However, in winter, the Crimean peninsula and the Sea of Azov are affected by cold winds, sometimes violent.
Simferopol
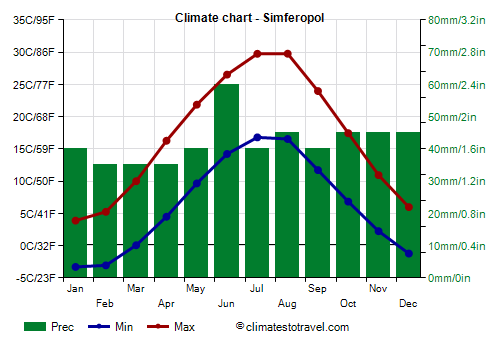
In
Simferopol, located in the interior of the peninsula, the average January temperature is 0.3 °C (32.5 °F), while highs in summer reach 30 °C (86 °F).
In Simferopol, 530 mm (21 in) of rain fall per year.
Yalta
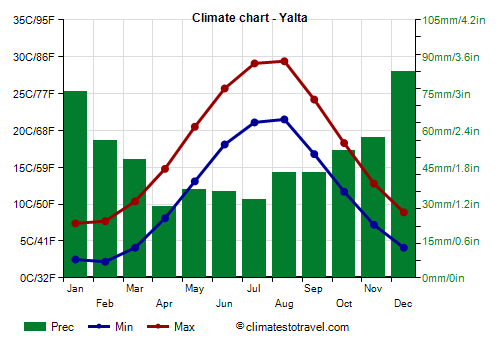
The only relatively mild area in winter is the south coast of the peninsula (see
Yalta), south of the Crimean Mountains: these mountains partially protect the coast from the cold northern wind, which turns into a down-slope, dry and relatively warm wind. Here, the average winter temperatures are about 5 °C (41 °F).
On average, 590 mm (23 in) of rain fall per year, with a maximum in December and January. Summer is hot and sunny, with some thunderstorms.
The sea in Yalta and Sevastopol reaches 24 °C (75 °F) in July and August.
Mountains
Ukraine is a large country, the second in Europe with an area of 603,600 km² (233,050 mi²), and it is largely occupied by plains (in the east) and hills (in the west). The only mountainous area of some importance is found in the west, south of Lviv, where there's a portion of the aforementioned
Carpathian Mountains, which reaches its highest point in Mount Hoverla, 2,061 meters (6,762 feet) high. Here, of course, the temperature decreases with increasing altitude, especially in summer, while in winter, cold air often clings to the soil, causing a thermal inversion that keeps the plain cold. In summer, thunderstorms in the mountains are more frequent and abundant.
Other mountains, though less extended, are the aforementioned
Crimean Mountains, whose highest point is Mount Roman-Koš, 1,545 meters (5,069 feet) high.
When to go
The best time to visit Ukraine as a whole runs from
mid-May to mid-September.
In order to avoid heat waves, which may occur in midsummer (July and August), especially the south-central and in the east of the country, you can opt for the two periods, mid-May to late June and the first half of September. However, those who can stand the heat can also go in July and August.
The best time for a
beach holiday in the Black Sea Coast is the mid-summer period (July and August), when you will find sunny and warm weather, tempered by sea breezes, with a few rainy days.
What to pack
In
winter: pack very warm clothes, such as a sweater or fleece, a down jacket, a fur hat, gloves, and a scarf. For Jalta, pack a sweater, a jacket, a raincoat or umbrella, and a scarf and earmuffs for the wind.
In
summer: in Lviv, pack spring/autumn clothes, being ready to add or remove the outer layer, and an umbrella. In the north-east and in Kyiv, pack T-shirts and shorts for hot days, a jacket and a sweatshirt for the evening and for cooler days, and an umbrella.
In the south and on the Black Sea coast: pack light clothes, and a sweatshirt or light jacket for the evening.
Climate data - Ukraine
| Chernihiv |
|---|
|
| Jan | Feb | Mar | Apr | May | Jun | Jul | Aug | Sep | Oct | Nov | Dec |
|---|
| Min temp. | -7 | -6 | -2 | 4 | 9 | 13 | 15 | 14 | 9 | 4 | -1 | -5 |
|---|
| Max temp. | -2 | 0 | 6 | 14 | 21 | 24 | 26 | 26 | 20 | 12 | 4 | 0 |
|---|
| Precip. | 35 | 40 | 35 | 40 | 55 | 70 | 70 | 60 | 55 | 40 | 50 | 45 |
|---|
| Prec. days | 9 | 9 | 8 | 7 | 8 | 9 | 9 | 7 | 8 | 7 | 9 | 10 |
|---|
|
| Day length | 8 | 10 | 12 | 14 | 16 | 16 | 16 | 14 | 13 | 11 | 9 | 8 |
|---|
| Sun hours | 2 | 2 | 4 | 6 | 9 | 9 | 9 | 8 | 5 | 4 | 1 | 1 |
|---|
|
| Chernobyl |
|---|
|
| Jan | Feb | Mar | Apr | May | Jun | Jul | Aug | Sep | Oct | Nov | Dec |
|---|
| Min temp. | -6 | -7 | -2 | 4 | 9 | 12 | 14 | 13 | 9 | 4 | -1 | -5 |
|---|
| Max temp. | -1 | 0 | 6 | 14 | 21 | 24 | 26 | 25 | 19 | 12 | 4 | 0 |
|---|
| Precip. | 35 | 35 | 35 | 40 | 60 | 75 | 80 | 55 | 55 | 40 | 50 | 45 |
|---|
| Prec. days | 8 | 9 | 8 | 8 | 9 | 10 | 9 | 7 | 9 | 7 | 9 | 9 |
|---|
|
| Day length | 8 | 10 | 12 | 14 | 16 | 16 | 16 | 14 | 13 | 11 | 9 | 8 |
|---|
|
|
| Dnipro |
|---|
|
| Jan | Feb | Mar | Apr | May | Jun | Jul | Aug | Sep | Oct | Nov | Dec |
|---|
| Min temp. | -6 | -6 | -1 | 5 | 11 | 15 | 17 | 16 | 11 | 5 | 0 | -4 |
|---|
| Max temp. | -1 | 1 | 7 | 16 | 23 | 27 | 29 | 29 | 22 | 14 | 6 | 1 |
|---|
| Precip. | 40 | 35 | 30 | 40 | 45 | 60 | 60 | 35 | 35 | 30 | 45 | 50 |
|---|
| Prec. days | 11 | 9 | 10 | 7 | 7 | 8 | 6 | 6 | 6 | 5 | 8 | 9 |
|---|
|
| Day length | 9 | 10 | 12 | 14 | 15 | 16 | 16 | 14 | 12 | 11 | 9 | 8 |
|---|
| Sun hours | 1 | 3 | 4 | 6 | 9 | 9 | 10 | 9 | 7 | 4 | 2 | 1 |
|---|
|
| Donetsk (230 meters) |
|---|
|
| Jan | Feb | Mar | Apr | May | Jun | Jul | Aug | Sep | Oct | Nov | Dec |
|---|
| Min temp. | -6 | -6 | -2 | 5 | 10 | 14 | 16 | 16 | 10 | 5 | 0 | -5 |
|---|
| Max temp. | -2 | -1 | 5 | 15 | 22 | 25 | 28 | 27 | 21 | 13 | 5 | -1 |
|---|
| Precip. | 40 | 30 | 35 | 40 | 45 | 70 | 55 | 35 | 40 | 35 | 40 | 40 |
|---|
| Prec. days | 11 | 8 | 10 | 13 | 13 | 14 | 11 | 8 | 11 | 11 | 13 | 11 |
|---|
|
|
|
|
| Feodosia |
|---|
|
| Jan | Feb | Mar | Apr | May | Jun | Jul | Aug | Sep | Oct | Nov | Dec |
|---|
| Min temp. | -1 | 0 | 3 | 7 | 13 | 18 | 20 | 20 | 15 | 10 | 5 | 2 |
|---|
| Max temp. | 5 | 6 | 10 | 15 | 21 | 26 | 30 | 30 | 24 | 18 | 11 | 7 |
|---|
| Precip. | 45 | 35 | 40 | 30 | 40 | 45 | 35 | 40 | 45 | 40 | 40 | 45 |
|---|
| Prec. days | 12 | 8 | 10 | 11 | 9 | 7 | 7 | 6 | 9 | 8 | 12 | 12 |
|---|
|
|
| Sun hours | 2 | 3 | 4 | 6 | 8 | 9 | 10 | 9 | 8 | 5 | 3 | 2 |
|---|
|
| Ivano Frankivsk (260 meters) |
|---|
|
| Jan | Feb | Mar | Apr | May | Jun | Jul | Aug | Sep | Oct | Nov | Dec |
|---|
| Min temp. | -6 | -5 | -2 | 3 | 8 | 12 | 14 | 13 | 8 | 4 | 0 | -4 |
|---|
| Max temp. | 1 | 3 | 8 | 15 | 20 | 24 | 26 | 25 | 20 | 14 | 7 | 2 |
|---|
| Precip. | 30 | 30 | 35 | 50 | 75 | 90 | 90 | 75 | 60 | 45 | 35 | 35 |
|---|
| Prec. days | 7 | 8 | 8 | 8 | 10 | 11 | 10 | 9 | 8 | 7 | 7 | 8 |
|---|
|
| Day length | 9 | 10 | 12 | 14 | 15 | 16 | 16 | 14 | 12 | 11 | 9 | 8 |
|---|
|
|
| Izmail |
|---|
|
| Jan | Feb | Mar | Apr | May | Jun | Jul | Aug | Sep | Oct | Nov | Dec |
|---|
| Min temp. | -4 | -2 | 1 | 6 | 11 | 15 | 18 | 17 | 12 | 7 | 3 | -2 |
|---|
| Max temp. | 3 | 6 | 11 | 17 | 23 | 27 | 30 | 30 | 24 | 18 | 11 | 5 |
|---|
| Precip. | 30 | 30 | 35 | 35 | 40 | 60 | 45 | 35 | 40 | 30 | 35 | 35 |
|---|
| Prec. days | 5 | 5 | 5 | 6 | 6 | 7 | 5 | 4 | 4 | 5 | 5 | 6 |
|---|
|
| Day length | 9 | 10 | 12 | 14 | 15 | 16 | 15 | 14 | 12 | 11 | 10 | 9 |
|---|
|
|
| Kerch |
|---|
|
| Jan | Feb | Mar | Apr | May | Jun | Jul | Aug | Sep | Oct | Nov | Dec |
|---|
| Min temp. | -2 | -2 | 1 | 6 | 11 | 16 | 19 | 19 | 14 | 9 | 4 | 0 |
|---|
| Max temp. | 4 | 4 | 9 | 15 | 21 | 26 | 29 | 29 | 23 | 17 | 10 | 6 |
|---|
| Precip. | 40 | 30 | 35 | 30 | 30 | 55 | 35 | 40 | 35 | 30 | 40 | 35 |
|---|
| Prec. days | 10 | 9 | 11 | 11 | 9 | 10 | 6 | 6 | 8 | 9 | 11 | 11 |
|---|
|
|
| Sun hours | 2 | 3 | 5 | 6 | 9 | 10 | 11 | 10 | 8 | 5 | 3 | 2 |
|---|
|
| Kharkiv |
|---|
|
| Jan | Feb | Mar | Apr | May | Jun | Jul | Aug | Sep | Oct | Nov | Dec |
|---|
| Min temp. | -7 | -7 | -2 | 5 | 10 | 14 | 16 | 15 | 10 | 4 | -1 | -6 |
|---|
| Max temp. | -2 | -1 | 5 | 15 | 21 | 25 | 27 | 27 | 20 | 12 | 4 | -1 |
|---|
| Precip. | 30 | 35 | 35 | 30 | 55 | 60 | 65 | 50 | 50 | 40 | 35 | 35 |
|---|
| Prec. days | 8 | 8 | 9 | 6 | 8 | 8 | 8 | 5 | 6 | 7 | 6 | 8 |
|---|
| Humidity | 86% | 82% | 73% | 60% | 58% | 60% | 60% | 56% | 63% | 74% | 84% | 87% |
|---|
| Day length | 9 | 10 | 12 | 14 | 15 | 16 | 16 | 14 | 12 | 11 | 9 | 8 |
|---|
| Sun hours | 1 | 2 | 4 | 6 | 8 | 9 | 9 | 8 | 6 | 4 | 2 | 1 |
|---|
|
| Kherson |
|---|
|
| Jan | Feb | Mar | Apr | May | Jun | Jul | Aug | Sep | Oct | Nov | Dec |
|---|
| Min temp. | -4 | -4 | 0 | 5 | 11 | 15 | 18 | 17 | 12 | 6 | 2 | -2 |
|---|
| Max temp. | 1 | 3 | 9 | 16 | 23 | 28 | 30 | 30 | 24 | 16 | 8 | 3 |
|---|
| Precip. | 35 | 30 | 30 | 30 | 45 | 60 | 45 | 30 | 40 | 35 | 35 | 40 |
|---|
| Prec. days | 9 | 7 | 9 | 12 | 11 | 11 | 9 | 6 | 9 | 9 | 12 | 10 |
|---|
|
|
| Sun hours | 2 | 3 | 5 | 7 | 9 | 10 | 11 | 10 | 8 | 5 | 3 | 2 |
|---|
|
| Kryvyi Rih |
|---|
|
| Jan | Feb | Mar | Apr | May | Jun | Jul | Aug | Sep | Oct | Nov | Dec |
|---|
| Min temp. | -6 | -5 | -1 | 5 | 10 | 14 | 16 | 16 | 11 | 5 | 0 | -4 |
|---|
| Max temp. | -1 | 1 | 7 | 16 | 22 | 26 | 29 | 28 | 22 | 14 | 6 | 1 |
|---|
| Precip. | 30 | 25 | 30 | 35 | 50 | 60 | 50 | 35 | 40 | 30 | 35 | 35 |
|---|
| Prec. days | 9 | 7 | 11 | 9 | 14 | 12 | 12 | 7 | 9 | 12 | 14 | 9 |
|---|
|
|
| Sun hours | 2 | 3 | 5 | 7 | 9 | 10 | 11 | 10 | 7 | 5 | 2 | 1 |
|---|
|
| Kyiv |
|---|
|
| Jan | Feb | Mar | Apr | May | Jun | Jul | Aug | Sep | Oct | Nov | Dec |
|---|
| Min temp. | -5 | -5 | -1 | 6 | 11 | 15 | 17 | 16 | 11 | 5 | 0 | -4 |
|---|
| Max temp. | -1 | 1 | 6 | 15 | 21 | 24 | 26 | 26 | 20 | 13 | 5 | 0 |
|---|
| Precip. | 40 | 40 | 45 | 40 | 65 | 90 | 70 | 60 | 60 | 45 | 50 | 45 |
|---|
| Prec. days | 8 | 8 | 9 | 7 | 9 | 10 | 9 | 7 | 7 | 7 | 8 | 9 |
|---|
| Humidity | 84% | 80% | 72% | 61% | 62% | 64% | 65% | 64% | 70% | 78% | 86% | 87% |
|---|
| Day length | 9 | 10 | 12 | 14 | 16 | 16 | 16 | 14 | 13 | 11 | 9 | 8 |
|---|
| Sun hours | 1 | 2 | 4 | 5 | 8 | 9 | 9 | 8 | 6 | 4 | 2 | 1 |
|---|
|
| Luhansk |
|---|
|
| Jan | Feb | Mar | Apr | May | Jun | Jul | Aug | Sep | Oct | Nov | Dec |
|---|
| Min temp. | -6 | -6 | -2 | 4 | 10 | 14 | 16 | 15 | 9 | 5 | 0 | -4 |
|---|
| Max temp. | -1 | 0 | 6 | 16 | 23 | 27 | 30 | 29 | 22 | 14 | 6 | 0 |
|---|
| Precip. | 35 | 35 | 30 | 30 | 45 | 65 | 65 | 35 | 45 | 35 | 40 | 40 |
|---|
| Prec. days | 10 | 8 | 11 | 14 | 13 | 14 | 12 | 8 | 11 | 11 | 13 | 10 |
|---|
|
|
| Sun hours | 2 | 3 | 4 | 6 | 9 | 10 | 10 | 9 | 7 | 4 | 2 | 1 |
|---|
|
| Lviv (280 meters) |
|---|
|
| Jan | Feb | Mar | Apr | May | Jun | Jul | Aug | Sep | Oct | Nov | Dec |
|---|
| Min temp. | -6 | -5 | -1 | 4 | 9 | 12 | 14 | 13 | 9 | 4 | 0 | -4 |
|---|
| Max temp. | 0 | 2 | 7 | 14 | 20 | 23 | 25 | 24 | 19 | 13 | 7 | 1 |
|---|
| Precip. | 45 | 45 | 50 | 50 | 95 | 90 | 100 | 75 | 70 | 60 | 50 | 50 |
|---|
| Prec. days | 11 | 11 | 10 | 9 | 12 | 11 | 11 | 9 | 8 | 9 | 10 | 11 |
|---|
| Humidity | 83% | 81% | 77% | 69% | 71% | 71% | 75% | 76% | 79% | 80% | 84% | 85% |
|---|
| Day length | 9 | 10 | 12 | 14 | 15 | 16 | 16 | 14 | 12 | 11 | 9 | 8 |
|---|
| Sun hours | 2 | 3 | 4 | 6 | 7 | 8 | 8 | 7 | 6 | 5 | 2 | 1 |
|---|
|
| Mariupol |
|---|
|
| Jan | Feb | Mar | Apr | May | Jun | Jul | Aug | Sep | Oct | Nov | Dec |
|---|
| Min temp. | -5 | -4 | 0 | 6 | 12 | 17 | 19 | 18 | 13 | 7 | 1 | -3 |
|---|
| Max temp. | 0 | 1 | 6 | 14 | 20 | 26 | 28 | 28 | 22 | 14 | 6 | 2 |
|---|
| Precip. | 50 | 40 | 40 | 40 | 40 | 55 | 45 | 35 | 45 | 35 | 50 | 50 |
|---|
| Prec. days | 8 | 7 | 8 | 6 | 6 | 7 | 5 | 4 | 5 | 5 | 7 | 8 |
|---|
|
|
|
| Sea temp | 6 | 6 | 6 | 9 | 15 | 21 | 24 | 24 | 20 | 15 | 10 | 7 |
|---|
| Odessa |
|---|
|
| Jan | Feb | Mar | Apr | May | Jun | Jul | Aug | Sep | Oct | Nov | Dec |
|---|
| Min temp. | -3 | -2 | 2 | 7 | 13 | 17 | 19 | 18 | 14 | 9 | 4 | -1 |
|---|
| Max temp. | 2 | 3 | 8 | 14 | 20 | 25 | 28 | 28 | 22 | 15 | 9 | 4 |
|---|
| Precip. | 30 | 35 | 40 | 25 | 40 | 50 | 40 | 55 | 45 | 25 | 50 | 30 |
|---|
| Prec. days | 6 | 6 | 7 | 5 | 6 | 7 | 5 | 5 | 4 | 4 | 6 | 5 |
|---|
| Humidity | 85% | 81% | 75% | 69% | 68% | 64% | 59% | 58% | 67% | 76% | 83% | 86% |
|---|
| Day length | 9 | 10 | 12 | 14 | 15 | 16 | 15 | 14 | 12 | 11 | 9 | 9 |
|---|
| Sun hours | 2 | 3 | 5 | 7 | 9 | 10 | 11 | 10 | 8 | 5 | 2 | 2 |
|---|
| Sea temp | 7 | 5 | 6 | 9 | 15 | 20 | 23 | 24 | 21 | 16 | 12 | 9 |
|---|
| Poltava |
|---|
|
| Jan | Feb | Mar | Apr | May | Jun | Jul | Aug | Sep | Oct | Nov | Dec |
|---|
| Min temp. | -6 | -6 | -2 | 5 | 11 | 15 | 16 | 16 | 10 | 5 | 0 | -5 |
|---|
| Max temp. | -2 | 0 | 6 | 15 | 22 | 25 | 28 | 27 | 21 | 13 | 5 | 0 |
|---|
| Precip. | 40 | 35 | 40 | 40 | 55 | 75 | 70 | 45 | 55 | 50 | 45 | 40 |
|---|
| Prec. days | 9 | 8 | 8 | 7 | 8 | 9 | 8 | 6 | 7 | 6 | 8 | 8 |
|---|
|
|
| Sun hours | 2 | 3 | 4 | 6 | 9 | 10 | 10 | 9 | 7 | 5 | 2 | 1 |
|---|
|
| Rivne (230 meters) |
|---|
|
| Jan | Feb | Mar | Apr | May | Jun | Jul | Aug | Sep | Oct | Nov | Dec |
|---|
| Min temp. | -6 | -5 | -2 | 4 | 9 | 12 | 14 | 13 | 9 | 4 | 0 | -4 |
|---|
| Max temp. | -1 | 1 | 6 | 14 | 20 | 23 | 25 | 25 | 19 | 13 | 6 | 0 |
|---|
| Precip. | 30 | 30 | 35 | 35 | 65 | 80 | 100 | 60 | 55 | 45 | 35 | 40 |
|---|
| Prec. days | 8 | 7 | 10 | 13 | 15 | 17 | 16 | 12 | 15 | 13 | 12 | 11 |
|---|
|
|
|
|
| Simferopol (300 meters) |
|---|
|
| Jan | Feb | Mar | Apr | May | Jun | Jul | Aug | Sep | Oct | Nov | Dec |
|---|
| Min temp. | -3 | -3 | 0 | 4 | 10 | 14 | 17 | 17 | 12 | 7 | 2 | -1 |
|---|
| Max temp. | 4 | 5 | 10 | 16 | 22 | 27 | 30 | 30 | 24 | 17 | 11 | 6 |
|---|
| Precip. | 45 | 35 | 40 | 35 | 40 | 65 | 45 | 50 | 40 | 45 | 45 | 45 |
|---|
| Prec. days | 9 | 8 | 8 | 6 | 6 | 7 | 5 | 5 | 6 | 6 | 7 | 9 |
|---|
| Humidity | 85% | 80% | 73% | 66% | 68% | 65% | 60% | 58% | 66% | 74% | 80% | 84% |
|---|
| Day length | 9 | 10 | 12 | 14 | 15 | 16 | 15 | 14 | 12 | 11 | 10 | 9 |
|---|
| Sun hours | 2 | 4 | 5 | 7 | 10 | 11 | 11 | 10 | 8 | 6 | 4 | 2 |
|---|
|
| Sumy |
|---|
|
| Jan | Feb | Mar | Apr | May | Jun | Jul | Aug | Sep | Oct | Nov | Dec |
|---|
| Min temp. | -7 | -7 | -3 | 4 | 9 | 13 | 15 | 14 | 9 | 4 | -1 | -5 |
|---|
| Max temp. | -3 | -2 | 4 | 14 | 21 | 24 | 26 | 26 | 19 | 12 | 3 | -2 |
|---|
| Precip. | 35 | 35 | 35 | 40 | 55 | 65 | 75 | 55 | 55 | 50 | 45 | 35 |
|---|
| Prec. days | 8 | 8 | 8 | 8 | 8 | 9 | 9 | 7 | 8 | 7 | 8 | 9 |
|---|
|
|
|
|
| Uzhhorod |
|---|
|
| Jan | Feb | Mar | Apr | May | Jun | Jul | Aug | Sep | Oct | Nov | Dec |
|---|
| Min temp. | -4 | -3 | 1 | 6 | 10 | 14 | 15 | 15 | 10 | 6 | 2 | -2 |
|---|
| Max temp. | 2 | 4 | 10 | 17 | 22 | 26 | 28 | 28 | 22 | 16 | 9 | 3 |
|---|
| Precip. | 55 | 55 | 40 | 45 | 70 | 70 | 80 | 65 | 70 | 60 | 60 | 65 |
|---|
| Prec. days | 11 | 10 | 13 | 15 | 16 | 16 | 15 | 13 | 13 | 13 | 14 | 13 |
|---|
|
|
| Sun hours | 2 | 3 | 5 | 7 | 9 | 9 | 9 | 9 | 6 | 5 | 2 | 1 |
|---|
|
| Vinnytsia (290 meters) |
|---|
|
| Jan | Feb | Mar | Apr | May | Jun | Jul | Aug | Sep | Oct | Nov | Dec |
|---|
| Min temp. | -6 | -5 | -2 | 4 | 9 | 13 | 15 | 14 | 9 | 4 | 0 | -4 |
|---|
| Max temp. | -1 | 0 | 6 | 14 | 20 | 24 | 26 | 25 | 19 | 13 | 5 | 0 |
|---|
| Precip. | 30 | 30 | 30 | 40 | 55 | 85 | 75 | 55 | 60 | 35 | 35 | 35 |
|---|
| Prec. days | 7 | 6 | 10 | 13 | 14 | 15 | 15 | 10 | 12 | 11 | 12 | 9 |
|---|
|
|
| Sun hours | 2 | 3 | 4 | 7 | 8 | 10 | 9 | 9 | 6 | 4 | 2 | 1 |
|---|
|
| Yalta |
|---|
|
| Jan | Feb | Mar | Apr | May | Jun | Jul | Aug | Sep | Oct | Nov | Dec |
|---|
| Min temp. | 2 | 2 | 4 | 8 | 13 | 18 | 21 | 22 | 17 | 12 | 7 | 4 |
|---|
| Max temp. | 7 | 8 | 10 | 15 | 20 | 26 | 29 | 29 | 24 | 18 | 13 | 9 |
|---|
| Precip. | 75 | 55 | 50 | 30 | 35 | 35 | 30 | 45 | 45 | 50 | 55 | 85 |
|---|
|
|
|
| Sun hours | 2 | 3 | 4 | 6 | 8 | 9 | 10 | 9 | 7 | 5 | 3 | 2 |
|---|
| Sea temp | 8 | 7 | 8 | 10 | 15 | 20 | 24 | 24 | 22 | 18 | 13 | 10 |
|---|
| Zaporizhzhia |
|---|
|
| Jan | Feb | Mar | Apr | May | Jun | Jul | Aug | Sep | Oct | Nov | Dec |
|---|
| Min temp. | -6 | -5 | -1 | 5 | 11 | 15 | 17 | 16 | 11 | 6 | 0 | -4 |
|---|
| Max temp. | 0 | 1 | 8 | 16 | 23 | 27 | 29 | 29 | 23 | 15 | 6 | 1 |
|---|
| Precip. | 40 | 30 | 35 | 40 | 50 | 60 | 45 | 45 | 40 | 35 | 40 | 55 |
|---|
| Prec. days | 8 | 8 | 6 | 7 | 6 | 7 | 6 | 5 | 5 | 4 | 7 | 9 |
|---|
|
| Day length | 9 | 10 | 12 | 14 | 15 | 16 | 16 | 14 | 12 | 11 | 9 | 8 |
|---|
|
|
See also the
temperatures month by month