Select units of measurement for the temperature and rainfall tables (metric or imperial).
Average weather, temperature, rainfall, sunshine hours

The climate of Chernihiv (or Chernigov) is
moderately continental, with very cold winters, in which the temperature is often below freezing, and pleasantly warm summers.
The city is located in the north of Ukraine, at 51 degrees north latitude, 120 kilometers (75 miles) north-east of Kyiv, 45 km (28 mi) away from the border with Belarus and 80 km (50 mi) away from the border with Russia.
Precipitation is not abundant in winter, when it is quite frequent and generally occurs in the form of snow, while it is more abundant in summer, when it can occur in the form of thunderstorm.
Winter is cold and gray. Snowfalls are frequent, but generally not abundant.
Sometimes there can be cold spells from Siberia, which were once more frequent and during which the temperature can drop to -20 °C (-4 °F) or even below. The coldest record is -36 °C (-32.8 °F) and was set in January 1987.
In
summer, temperatures are generally pleasant, although rains and thunderstorms can sometimes occur. There can also be cool days, more often than in south-central Ukraine.
Every now and then, there can be hot periods, usually of short duration, during which the temperature can reach or exceed 32/33 °C (90/91 °F). The highest record is 38 °C (100.4 °F) and was set in August 2010.
Chernihiv - Climate data
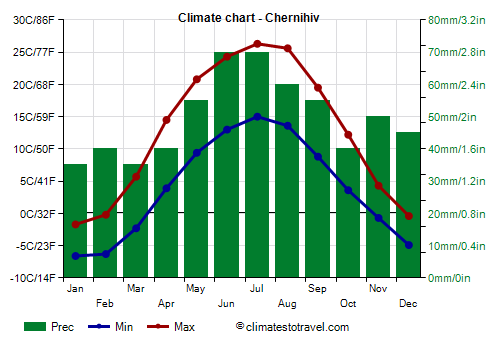
In Chernihiv, the
average temperature of the coldest month (January) is of
-4.1 °C, that of the warmest month (July) is of
20.6 °C. Here are the average temperatures.
Chernihiv - Average temperatures (1991-2020) |
| Month | Min | Max | Mean |
|---|
| January | -6.6 | -1.7 | -4.1 |
|---|
| February | -6.3 | -0.2 | -3.2 |
|---|
| March | -2.3 | 5.7 | 1.7 |
|---|
| April | 3.9 | 14.5 | 9.2 |
|---|
| May | 9.4 | 20.8 | 15.1 |
|---|
| June | 13 | 24.3 | 18.6 |
|---|
| July | 15 | 26.3 | 20.6 |
|---|
| August | 13.6 | 25.6 | 19.6 |
|---|
| September | 8.8 | 19.5 | 14.2 |
|---|
| October | 3.6 | 12.2 | 7.9 |
|---|
| November | -0.7 | 4.3 | 1.8 |
|---|
| December | -4.9 | -0.4 | -2.7 |
|---|
| Year | 3.9 | 12.6 | 8.25 |
|---|
amounts to
590 millimeters per year: so, it is at an intermediate level. It ranges from
35 millimeters in the driest months (January, March) to
70 millimeters in the wettest ones (June, July) Here is the average precipitation.
Chernihiv - Average precipitation| Month | Days |
|---|
| January | 35 | 9 |
|---|
| February | 40 | 9 |
|---|
| March | 35 | 8 |
|---|
| April | 40 | 7 |
|---|
| May | 55 | 8 |
|---|
| June | 70 | 9 |
|---|
| July | 70 | 9 |
|---|
| August | 60 | 7 |
|---|
| September | 55 | 8 |
|---|
| October | 40 | 7 |
|---|
| November | 50 | 9 |
|---|
| December | 45 | 10 |
|---|
| Year | 590 | 100 |
|---|
There are on average around 1865
sunshine hours per year. Here are the average hours of sunshine per day.
Chernihiv - Sunshine hours| Month | Average | Total |
|---|
| January | 1.5 | 45 |
|---|
| February | 2.5 | 70 |
|---|
| March | 4 | 130 |
|---|
| April | 6 | 185 |
|---|
| May | 9 | 275 |
|---|
| June | 9 | 270 |
|---|
| July | 9 | 280 |
|---|
| August | 8.5 | 260 |
|---|
| September | 5.5 | 160 |
|---|
| October | 3.5 | 110 |
|---|
| November | 1.5 | 40 |
|---|
| December | 1 | 35 |
|---|
| Year | 5.1 | 1865 |
|---|