Select units of measurement for the temperature and rainfall tables (metric or imperial).
Average weather, temperature, rainfall, sunshine
The climate of Senegal, a West African country between the Tropic and the Equator, is
tropical, with a long dry season (which runs roughly from mid-October to mid-June in the north, and from early November to mid-May in the south) and a rainy season (approximately, from late June to early October in the north, and from late May to late October in the south) due to the
African monsoon, which in summer arrives from the south.
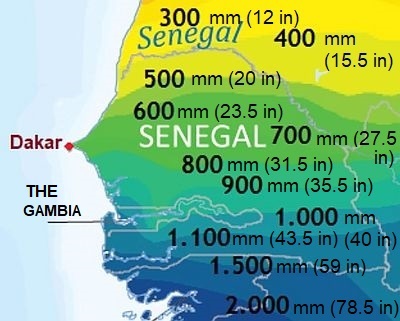
As a result, in the south, the annual rainfall is more abundant and is between 600 and 1,400 millimeters (23.5 and 55 inches) per year, while in the north and the center, which is part of the Sahel, the rainfall is below 600 mm (23.5 in).
Consequently, the landscape varies considerably, in fact, it is
semi-desert in the north, while there is the
savanna in the south, and also by gallery forests along the rivers.
Here is the average precipitation (in millimeters and inches).
 Temperatures
 are higher in inland areas than on the coast, especially in the period before the rains, from March to June, when they often exceed 40 °C (104 °F).
The climate in detail
The seasons
In the
dry season, a dry north-eastern wind, called
Harmattan, capable of filling the air with dust from the desert, often blows throughout the country. In the coolest months,
December and January, the daytime temperature ranges between 32 °C and 35 °C (90 °F and 95 °F) in inland areas, while it is a bit less hot on the coast, and much cooler in Dakar, around 26 °C (79 °F). Sometimes, it can get a bit cool at night across the country, with temperatures below 15 °C (59 °F), while at other times, it can get very hot during the day, with highs around 35 °C (95 °F) in Dakar and 40 °C (104 °F) in the interior.
Starting from
February, the temperature begins to rise, and reaches its highest levels from April to early June, before the arrival of the monsoon. In the interior, highs are normally around 38 °C (100 °F) in the south and 43/44 °C (109/111 °F) in the north, while the coast is definitely more temperate, especially in Dakar, where the average maximum is still around 26 °C (79 °F) in May. Heat spikes are noticeable: up to 47/48 °C (117/118 °F) in the north-eastern inland areas.
The
rainy season goes roughly from June to October and is known as
hivernage ("wintering"), but despite the name it's a hot and humid period, especially in the south, while in the north, moist and rainy days alternate with hot and dry days. Compared to the previous period, the temperature decreases, but at the same time moisture increases. The rains occur in the form of showers in the north and the center, while they are more persistent in the south, where the sky is often cloudy.
As mentioned, the
rains are all the more abundant the further you go south. In the northernmost region of Saint-Louis, where the Djoudj National Bird Sanctuary is located, and in the cities that rise along the Senegal river, such as Richard-Toll and
Podor, precipitation amounts to only 240/350 mm (9.5/13.5 in) per year. In the central belt, rainfall amounts to 500-700 mm (20-27.5 in) per year, while in the south, it reaches 1,600 mm (63 in).
The temperatures are different as well: the monsoon lowers the daytime temperatures to 32/33 °C (90/91 °F) in the south, while in the north, they remain higher, around 36 °C (97 °F).
At the end of the rainy season,
between October and November, the temperature increases again, reaching 38/39 °C (100/102 °F) in the center-north; this phenomenon is much less evident in the south. In Dakar, which is a world apart compared with the rest of the country, the trend is very different: the temperature rises gradually until it reaches about 31/31.5 °C (88/89 °F) during the warmest months, which are September and October.
The center-north
Along the northern part of the
coast, at least down to the latitude of Dakar, a
cool sea current flows, which lowers the temperature of the coastal towns by a few degrees, compared with inland areas.
Saint-Louis
In the northern part of the coast, in
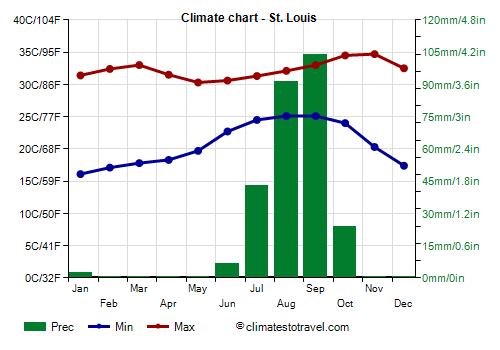
Saint-Louis, during the day, it is hot all year round, and the temperatures are fairly constant, around 31/32 °C (87/90 °F), except in the period from September to November, when they are a little higher. At night, however, the temperatures vary in a more clear manner: winter nights are cool, while in summer, in the rainy season, hot and muggy weather dominates.
However, there can be torrid (very hot and dry) days all year round, when the wind blows from the interior.
In Saint-Louis, 270 mm (10.5 in) of rain fall per year; the only rainy period is from July to early October, when, however, the rains are not particularly frequent nor abundant (but during some years they can be abundant, especially in August and September).
The sun in Saint-Louis shines all year round, and it's often seen even in the rainy season.
The sea in Saint-Louis is cool from January to May, while it gets warm enough for swimming from June to December, with a maximum from August to October.

South of Saint-Louis, a short distance from the sea, there is even a small desert with sand dunes, the
Lompoul Desert.

Dakar
The capital,
Dakar, is located in a
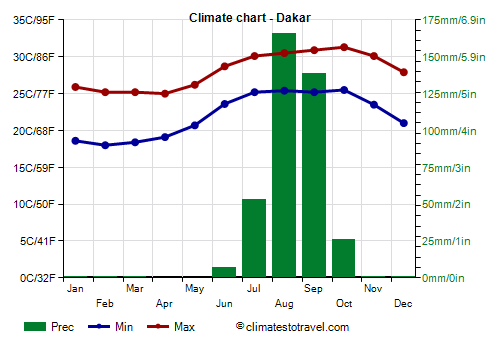
particularly mild area because it's on the tip of a peninsula (the Cap-Vert peninsula), overlooking the ocean, and enjoys by far the mildest climate of Senegal. As a matter of fact, sometimes, until April or even May, a very cool wind blows from the sea. Maximum temperatures range from 25 °C (77 °F) in the February-April period to 31 °C (88 °F) in September and October.
In Dakar, 395 mm (15.5 in) of rain fall per year; the only very rainy months, when rainfall exceeds 130 mm (5 in), are August and September.
The sun in Dakar shines for a good number of hours all year round, though a little less from July to September, ie the rainy season.
The
sea, at the height of Dakar, is definitely cool from January to April, around 20/21 °C (68/70 °F), while it becomes warm from June to November, from 25 °C to 28 °C (77 °F to 82 °F).

The coast south of Dakar, called
Petite Côte ("Small Coast", see Rufisque, Popenguine, Saly, Nianing), is sheltered from the currents and has often a calm sea.
Matam
In the inland areas of the north, occupied by a semi-desert plain called
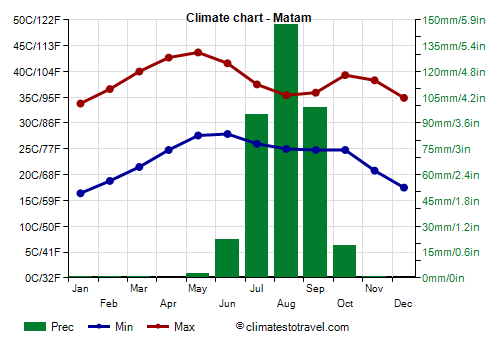
Ferlo, the temperatures are much higher. It is often very hot even in winter, though the hottest period is from April to June, before the rains arrive. Since the rainy season here is not very noticeable, the heat is intense even in this period.
In
Matam, in the north-east, the temperatures can exceed 40 °C (104 °F) all year round, with peaks of 47/48 °C (117/118 °F) in April and May.
On average, 385 mm (15 in) of rain fall per year, and more than 90 mm (3.5 in) fall per month only from July to September.

The south
In the south, the rainy season is
more intense and a little longer, to the point of changing the landscape, which becomes greener, especially during the rainy period. During this period, the temperature decreases more clearly and goes to down to around 31 °C (88 °F) on the coast and 32/33 °C (90/91 °F) in inland areas; on the other hand, the humidity increases. The most humid region is the one called
Casamance, located south of the Gambia.
Cap Skirring
In the southernmost part of the coast, in
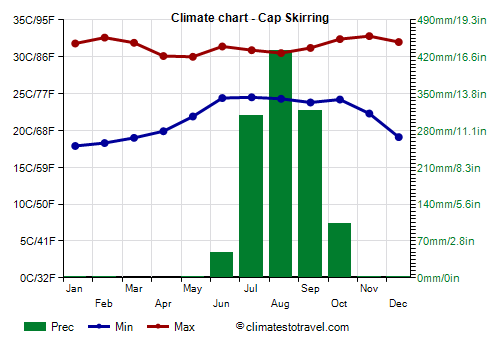
Cap Skirring, it is hot all year round, and the temperatures are fairly uniform. Here too, however, night temperatures are slightly lower from December to February, while in the rainy season, the weather is hot and humid. In April and May, the temperature tends to decrease a bit, even though it still doesn't rain.
In Cap Skirring, 1,200 mm (47 in) of rain fall, with more than 100 mm (4 in) per month from July to October (and a maximum in August), and very rare or absent rains in the rest of the year.
In winter, the sea in Cap Skirring is not as cool as in Dakar, in fact, the water temperature does not drop below 22/23 °C (72/73 °F) from January to April.
In the south too, the
interior is hotter than the coast, especially from February to May, while the summer temperatures decrease more clearly because the rains are more frequent and abundant.
Ziguinchor
In
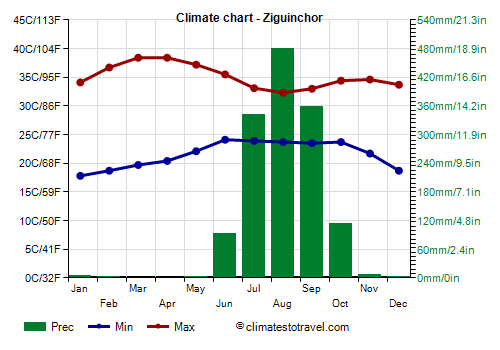
Ziguinchor, the maximum temperatures reach 37/38 °C (99/100 °F) from March to May, while then they drop to 32/33 °C (90/91 °F) from July to September.
On average, 1,400 mm (55.5 in) of rain fall per year, including up to 485 mm (19 in) in August.
Both the
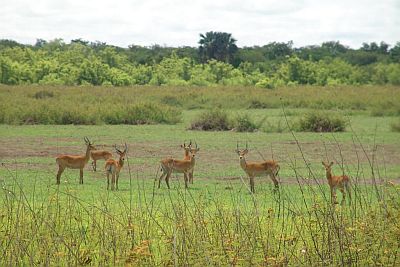
Niokolo-Koba Park, a UNESCO World Heritage Site, and the Dindefelo waterfalls, are located in the south-east, ie in the southern, most humid region.
Tropical cyclones
In the ocean to the west of Senegal, there is an area in which
hurricanes, the tropical cyclones of the Atlantic, start to form; after they are formed, they move towards the west or the northwest and head to the Caribbean. In general, Senegal is not affected by hurricanes because they develop at a considerable distance, however, hurricanes can occasionally form a short distance from the coast and affect Senegal as well, producing rainfall, as well as storm surges that can damage the coast, as happened in early September 2015 with Hurricane Fred.
Hurricanes are generally formed in this area in August and September.
When to go
The best time to visit Senegal is winter, from
December to mid-February: it's warm on the coast, even hot in the interior, the sun shines, and it practically never rains. Sometimes, the heat can be intense in inland areas, but humidity is low and nights remain pleasantly cool.
Spring is scorchingly hot, and partly autumn (after the rainy season), but at least, it doesn't rain.
It's better to avoid the rainy season, at least in the south and from July to September.
A special case is represented by
Dakar, where the weather is particularly mild, and good for a long period, from December to May. However, on the coast, the heat is generally less intense.
For a
beach holiday, you can go from November to May, although as previously mentioned, the sea is cool from January to May in the north-central, and (though a little less) from January to April in the south.
What to pack
In
winter: bring light clothes for the day, a sweatshirt and a jacket for the evening (until April or May for Dakar), and a scarf or turban for the sand.
In
summer: in the north, bring lightweight clothes, long and made of natural fabric (cotton or linen), a turban for the desert wind; in Dakar, you can add a light sweatshirt; in the south, a light sweatshirt and a light raincoat for the rain.
It's better for women to avoid shorts and miniskirts outside of the beaches.
Climate data - Senegal
| Bakel |
|---|
|
| Jan | Feb | Mar | Apr | May | Jun | Jul | Aug | Sep | Oct | Nov | Dec |
|---|
| Min temp. | 18 | 20 | 22 | 25 | 28 | 27 | 25 | 24 | 23 | 24 | 20 | 18 |
|---|
| Max temp. | 34 | 37 | 40 | 43 | 43 | 41 | 36 | 34 | 35 | 38 | 38 | 35 |
|---|
| Precip. | 0 | 0 | 0 | 0 | 5 | 50 | 140 | 200 | 155 | 35 | 0 | 0 |
|---|
| Prec. days | 0 | 0 | 0 | 0 | 1 | 4 | 9 | 11 | 9 | 3 | 0 | 0 |
|---|
|
|
|
|
| Cap Skirring |
|---|
|
| Jan | Feb | Mar | Apr | May | Jun | Jul | Aug | Sep | Oct | Nov | Dec |
|---|
| Min temp. | 18 | 18 | 19 | 20 | 22 | 24 | 24 | 24 | 24 | 24 | 22 | 19 |
|---|
| Max temp. | 32 | 33 | 32 | 30 | 30 | 31 | 31 | 30 | 31 | 32 | 33 | 32 |
|---|
| Precip. | 0 | 0 | 0 | 0 | 5 | 50 | 310 | 430 | 320 | 100 | 0 | 0 |
|---|
| Prec. days | 0 | 0 | 0 | 0 | 0 | 4 | 16 | 19 | 16 | 8 | 0 | 0 |
|---|
| Humidity | 58% | 61% | 68% | 75% | 78% | 78% | 82% | 85% | 84% | 81% | 72% | 62% |
|---|
| Day length | 12 | 12 | 12 | 12 | 13 | 13 | 13 | 12 | 12 | 12 | 12 | 11 |
|---|
|
| Sea temp | 23 | 22 | 22 | 23 | 24 | 28 | 28 | 28 | 28 | 29 | 28 | 26 |
|---|
| Dakar |
|---|
|
| Jan | Feb | Mar | Apr | May | Jun | Jul | Aug | Sep | Oct | Nov | Dec |
|---|
| Min temp. | 19 | 18 | 18 | 19 | 21 | 24 | 25 | 25 | 25 | 26 | 24 | 21 |
|---|
| Max temp. | 26 | 25 | 25 | 25 | 26 | 29 | 30 | 30 | 31 | 31 | 30 | 28 |
|---|
| Precip. | 0 | 0 | 0 | 0 | 0 | 5 | 55 | 165 | 140 | 25 | 0 | 0 |
|---|
| Prec. days | 0 | 0 | 0 | 0 | 0 | 1 | 4 | 10 | 9 | 2 | 0 | 0 |
|---|
| Humidity | 65% | 71% | 76% | 82% | 82% | 81% | 79% | 82% | 84% | 80% | 71% | 65% |
|---|
| Day length | 11 | 12 | 12 | 12 | 13 | 13 | 13 | 13 | 12 | 12 | 11 | 11 |
|---|
| Sun hours | 8 | 9 | 9 | 10 | 9 | 8 | 8 | 7 | 7 | 8 | 8 | 8 |
|---|
| Sea temp | 22 | 20 | 20 | 21 | 23 | 26 | 28 | 28 | 28 | 28 | 27 | 24 |
|---|
| Kedougou |
|---|
|
| Jan | Feb | Mar | Apr | May | Jun | Jul | Aug | Sep | Oct | Nov | Dec |
|---|
| Min temp. | 18 | 20 | 24 | 26 | 26 | 24 | 22 | 22 | 21 | 22 | 20 | 17 |
|---|
| Max temp. | 35 | 38 | 40 | 41 | 40 | 35 | 32 | 32 | 32 | 34 | 36 | 35 |
|---|
| Precip. | 0 | 0 | 0 | 5 | 50 | 160 | 265 | 350 | 310 | 100 | 5 | 0 |
|---|
| Prec. days | 0 | 0 | 0 | 0 | 4 | 11 | 15 | 19 | 18 | 7 | 1 | 0 |
|---|
| Humidity | 29% | 26% | 29% | 34% | 45% | 63% | 76% | 80% | 79% | 71% | 49% | 36% |
|---|
| Day length | 12 | 12 | 12 | 12 | 13 | 13 | 13 | 12 | 12 | 12 | 12 | 11 |
|---|
|
|
| Matam |
|---|
|
| Jan | Feb | Mar | Apr | May | Jun | Jul | Aug | Sep | Oct | Nov | Dec |
|---|
| Min temp. | 16 | 19 | 22 | 25 | 28 | 28 | 26 | 25 | 25 | 25 | 21 | 18 |
|---|
| Max temp. | 34 | 37 | 40 | 43 | 44 | 42 | 38 | 35 | 36 | 39 | 38 | 35 |
|---|
| Precip. | 0 | 0 | 0 | 0 | 0 | 20 | 95 | 145 | 100 | 20 | 0 | 0 |
|---|
| Prec. days | 0 | 0 | 0 | 0 | 0 | 2 | 7 | 9 | 8 | 2 | 0 | 0 |
|---|
| Humidity | 31% | 28% | 27% | 27% | 30% | 40% | 58% | 70% | 71% | 53% | 37% | 35% |
|---|
| Day length | 11 | 12 | 12 | 12 | 13 | 13 | 13 | 13 | 12 | 12 | 11 | 11 |
|---|
|
|
| Podor |
|---|
|
| Jan | Feb | Mar | Apr | May | Jun | Jul | Aug | Sep | Oct | Nov | Dec |
|---|
| Min temp. | 16 | 18 | 20 | 22 | 24 | 25 | 25 | 25 | 26 | 25 | 21 | 18 |
|---|
| Max temp. | 32 | 34 | 37 | 40 | 42 | 41 | 38 | 37 | 37 | 39 | 37 | 33 |
|---|
| Precip. | 5 | 0 | 0 | 0 | 0 | 10 | 50 | 85 | 80 | 10 | 0 | 0 |
|---|
| Prec. days | 0 | 0 | 0 | 0 | 0 | 1 | 3 | 6 | 6 | 1 | 0 | 0 |
|---|
| Humidity | 27% | 27% | 27% | 27% | 30% | 40% | 55% | 63% | 62% | 44% | 33% | 31% |
|---|
| Day length | 11 | 12 | 12 | 12 | 13 | 13 | 13 | 13 | 12 | 12 | 11 | 11 |
|---|
|
|
| St. Louis |
|---|
|
| Jan | Feb | Mar | Apr | May | Jun | Jul | Aug | Sep | Oct | Nov | Dec |
|---|
| Min temp. | 16 | 17 | 18 | 18 | 20 | 23 | 24 | 25 | 25 | 24 | 20 | 17 |
|---|
| Max temp. | 31 | 32 | 33 | 32 | 30 | 31 | 31 | 32 | 33 | 34 | 35 | 32 |
|---|
| Precip. | 0 | 0 | 0 | 0 | 0 | 5 | 45 | 90 | 105 | 25 | 0 | 0 |
|---|
| Prec. days | 0 | 0 | 0 | 0 | 0 | 0 | 3 | 7 | 7 | 2 | 0 | 0 |
|---|
| Humidity | 45% | 49% | 57% | 66% | 73% | 79% | 79% | 81% | 81% | 72% | 56% | 49% |
|---|
| Day length | 11 | 12 | 12 | 12 | 13 | 13 | 13 | 13 | 12 | 12 | 11 | 11 |
|---|
| Sun hours | 8 | 8 | 9 | 10 | 9 | 7 | 8 | 8 | 8 | 8 | 8 | 8 |
|---|
| Sea temp | 20 | 20 | 20 | 20 | 21 | 24 | 26 | 28 | 28 | 28 | 26 | 23 |
|---|
| Tambacounda |
|---|
|
| Jan | Feb | Mar | Apr | May | Jun | Jul | Aug | Sep | Oct | Nov | Dec |
|---|
| Min temp. | 18 | 20 | 23 | 25 | 26 | 26 | 24 | 23 | 22 | 23 | 20 | 18 |
|---|
| Max temp. | 35 | 37 | 40 | 41 | 41 | 38 | 34 | 32 | 33 | 36 | 38 | 36 |
|---|
| Precip. | 0 | 0 | 0 | 0 | 15 | 85 | 165 | 225 | 200 | 55 | 5 | 0 |
|---|
| Prec. days | 0 | 0 | 0 | 0 | 1 | 6 | 11 | 15 | 13 | 4 | 0 | 0 |
|---|
| Humidity | 24% | 22% | 24% | 27% | 36% | 54% | 72% | 80% | 80% | 70% | 43% | 28% |
|---|
| Day length | 11 | 12 | 12 | 12 | 13 | 13 | 13 | 13 | 12 | 12 | 12 | 11 |
|---|
|
|
| Ziguinchor |
|---|
|
| Jan | Feb | Mar | Apr | May | Jun | Jul | Aug | Sep | Oct | Nov | Dec |
|---|
| Min temp. | 18 | 19 | 20 | 20 | 22 | 24 | 24 | 24 | 24 | 24 | 22 | 19 |
|---|
| Max temp. | 34 | 37 | 38 | 38 | 37 | 36 | 33 | 32 | 33 | 34 | 35 | 34 |
|---|
| Precip. | 5 | 0 | 0 | 0 | 5 | 95 | 340 | 480 | 360 | 115 | 5 | 0 |
|---|
| Prec. days | 1 | 0 | 0 | 0 | 1 | 7 | 18 | 21 | 18 | 8 | 0 | 0 |
|---|
| Humidity | 46% | 45% | 50% | 58% | 65% | 73% | 84% | 88% | 87% | 83% | 71% | 56% |
|---|
| Day length | 12 | 12 | 12 | 12 | 13 | 13 | 13 | 12 | 12 | 12 | 12 | 11 |
|---|
| Sun hours | 9 | 9 | 10 | 10 | 10 | 8 | 6 | 6 | 7 | 8 | 9 | 9 |
|---|
|
See also the
temperatures month by month