Select units of measurement for the temperature and rainfall tables (metric or imperial).
Average weather, temperature, rainfall, sunshine
In the Gambia, a small country overlooking the Atlantic Ocean and crossed by the river of the same name, the climate is
tropical, hot all year round, with a dry season from November to May, and a rainy season from June to mid-October due to the African monsoon.
Along the coast, the climate is tempered by the ocean, while in the interior, the heat is more intense.
Annual
rainfall ranges between 800 and 1,000 millimeters (31.5 and 40 inches). The rainiest area is the southern one.
The
sun shines regularly in the dry season, while in the rainy season, the sky is often cloudy, especially in July and August.
The climate in detail
The seasons
In
winter, in December and January, it's hot during the day, with highs around 32/33 °C (90/91 °F), but with peaks of 38/40 °C (100/104 °F) even on the coast. However, the air is dry and nights are cool. The wind blowing from the desert, the
Harmattan, can veil the sun and lift dust.
Already in February, the temperature begins to increase in inland areas, reaching 39/40 °C (102/104 °F) from March to May, while along the coast, the heat is less intense, but moisture is higher.
So, the
spring (which, as regards to the temperature, should be considered as the real summer) is a very hot season everywhere.
With the arrival of the
rains, the temperature decreases, dropping to about 31/32 °C (88/90 °F) during the day, but the humidity increases and the heat becomes sweltering.
The first showers occur in June, but the rains are really abundant in
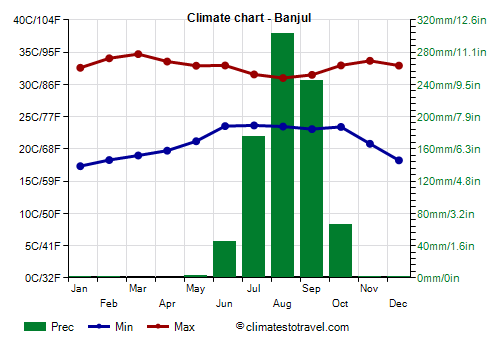
July, August and September, when they exceed 200 mm (8 in) per month. August is the rainiest month, when rainfall exceeds 300 mm (12 in) in Banjul. Sometimes, however, it can get very hot even in this season, in the pauses between the rainy periods.
Between October and November, after the rains, the temperature rises again, especially in inland areas.
Banjul

The capital,
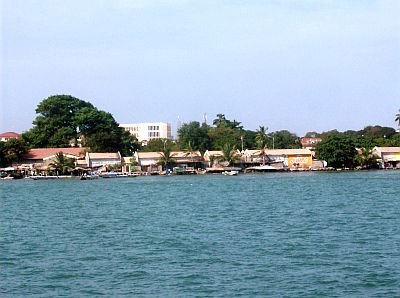
Banjul, is located on the coast, the least hot area of the country. Here, the maximum temperatures approach 35 °C (95 °F) in February and March.
On average, 840 mm (33 in) of rain fall per year.
The
sea in the Gambia is a bit cool from January to April, when the water temperature fluctuates about 21/22 °C (70/72 °F), while it's warm during the rainy season. In November, the first month after the rains, the sea is still warm.

Basse

As mentioned, in inland areas it is hotter, especially in the period preceding the monsoon. But in winter, nights are cool.
In
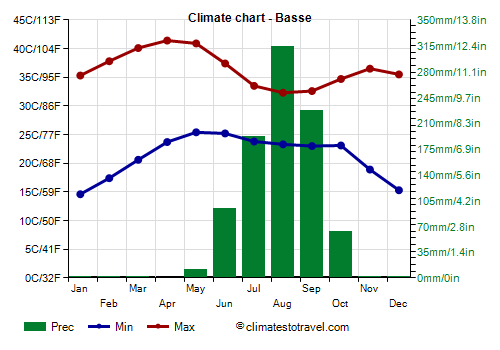
Basse Santa Su, located in the eastern part of the country, the maximum temperatures reach 40/41 °C (104/106 °F) from March to May.
On average, 905 mm (35.5 in) of rain fall per year.
Hurricanes
In the ocean to the west of Senegal, there is an area in which
hurricanes, the tropical cyclones of the Atlantic, start to form; after they are formed, they move towards the west or the northwest and head to the Caribbean.
So, usually Gambia is not affected by hurricanes because they develop at a considerable distance; however, a hurricane can occasionally be formed a short distance from the coast and affect Gambia as well, with rainfall and storm surges which can damage the coast, as happened at the beginning of September 2015 with Hurricane Fred.
Hurricanes are generally formed in this area in August and September.
When to go
The best time to travel to Gambia is
winter, especially the months of December and January, in fact, already in February, it gets very hot in inland areas.
On the
coast, the heat is tempered by the breeze, so the favorable season for a beach holiday is longer, and all in all, it goes from November to May, although the sea is a bit cool from January to April.
We advise against the period July-September because of heavy rains, which can cause flooding and make it difficult to travel throughout the country.
What to pack
In
winter: bring light clothes for the day, a sweatshirt for the evening and for boat trips, and a scarf for the wind-borne dust and sand.
In
summer: bring light clothing of natural fibers, a light sweatshirt and a light raincoat for the rain showers. It's better for women to avoid shorts and miniskirts outside of tourist resorts.
Climate data - Gambia
| Banjul |
|---|
|
| Jan | Feb | Mar | Apr | May | Jun | Jul | Aug | Sep | Oct | Nov | Dec |
|---|
| Min temp. | 17 | 18 | 19 | 20 | 21 | 24 | 24 | 23 | 23 | 23 | 21 | 18 |
|---|
| Max temp. | 33 | 34 | 35 | 34 | 33 | 33 | 32 | 31 | 31 | 33 | 34 | 33 |
|---|
| Precip. | 0 | 0 | 0 | 0 | 0 | 45 | 175 | 305 | 245 | 65 | 0 | 0 |
|---|
| Prec. days | 0 | 0 | 0 | 0 | 0 | 3 | 11 | 16 | 14 | 4 | 0 | 0 |
|---|
| Humidity | 45% | 44% | 52% | 61% | 69% | 73% | 81% | 86% | 86% | 81% | 67% | 52% |
|---|
| Day length | 11 | 12 | 12 | 12 | 13 | 13 | 13 | 12 | 12 | 12 | 12 | 11 |
|---|
| Sun hours | 7 | 8 | 9 | 8 | 7 | 7 | 6 | 6 | 6 | 7 | 8 | 7 |
|---|
| Sea temp | 22 | 21 | 21 | 22 | 24 | 27 | 29 | 28 | 28 | 29 | 28 | 25 |
|---|
| Basse |
|---|
|
| Jan | Feb | Mar | Apr | May | Jun | Jul | Aug | Sep | Oct | Nov | Dec |
|---|
| Min temp. | 15 | 17 | 21 | 24 | 25 | 25 | 24 | 23 | 23 | 23 | 19 | 15 |
|---|
| Max temp. | 35 | 38 | 40 | 41 | 41 | 37 | 34 | 32 | 33 | 35 | 36 | 36 |
|---|
| Precip. | 0 | 0 | 0 | 0 | 10 | 95 | 190 | 315 | 225 | 65 | 0 | 0 |
|---|
| Prec. days | 0 | 0 | 0 | 0 | 1 | 6 | 12 | 16 | 14 | 5 | 0 | 0 |
|---|
|
|
|
|
| Fatoto |
|---|
|
| Jan | Feb | Mar | Apr | May | Jun | Jul | Aug | Sep | Oct | Nov | Dec |
|---|
| Min temp. | 15 | 17 | 20 | 23 | 24 | 24 | 23 | 23 | 23 | 23 | 19 | 15 |
|---|
| Max temp. | 35 | 38 | 40 | 42 | 41 | 38 | 34 | 32 | 33 | 35 | 37 | 35 |
|---|
| Precip. | 0 | 0 | 0 | 0 | 10 | 80 | 180 | 245 | 205 | 55 | 0 | 0 |
|---|
| Prec. days | 0 | 0 | 0 | 0 | 1 | 6 | 11 | 15 | 13 | 4 | 0 | 0 |
|---|
|
|
|
|
| Janjanbureh |
|---|
|
| Jan | Feb | Mar | Apr | May | Jun | Jul | Aug | Sep | Oct | Nov | Dec |
|---|
| Min temp. | 15 | 17 | 19 | 21 | 24 | 24 | 24 | 24 | 23 | 23 | 18 | 15 |
|---|
| Max temp. | 35 | 37 | 39 | 41 | 40 | 37 | 33 | 32 | 32 | 34 | 36 | 35 |
|---|
| Precip. | 0 | 0 | 0 | 0 | 10 | 80 | 190 | 270 | 205 | 55 | 0 | 0 |
|---|
| Prec. days | 0 | 0 | 0 | 0 | 1 | 5 | 11 | 15 | 13 | 4 | 0 | 0 |
|---|
|
|
|
|
| Jenoi |
|---|
|
| Jan | Feb | Mar | Apr | May | Jun | Jul | Aug | Sep | Oct | Nov | Dec |
|---|
| Min temp. | 14 | 16 | 18 | 20 | 22 | 24 | 24 | 24 | 23 | 23 | 18 | 15 |
|---|
| Max temp. | 35 | 37 | 39 | 40 | 40 | 37 | 34 | 32 | 33 | 34 | 36 | 35 |
|---|
| Precip. | 0 | 0 | 0 | 0 | 5 | 75 | 210 | 255 | 225 | 65 | 0 | 0 |
|---|
| Prec. days | 0 | 0 | 0 | 0 | 0 | 4 | 12 | 16 | 14 | 4 | 0 | 0 |
|---|
|
|
|
|
| Kaur |
|---|
|
| Jan | Feb | Mar | Apr | May | Jun | Jul | Aug | Sep | Oct | Nov | Dec |
|---|
| Min temp. | 17 | 19 | 20 | 21 | 23 | 24 | 24 | 24 | 23 | 23 | 20 | 17 |
|---|
| Max temp. | 35 | 37 | 39 | 40 | 40 | 37 | 34 | 32 | 32 | 34 | 36 | 35 |
|---|
| Precip. | 0 | 0 | 0 | 0 | 5 | 65 | 160 | 270 | 215 | 70 | 0 | 0 |
|---|
| Prec. days | 0 | 0 | 0 | 0 | 0 | 3 | 10 | 15 | 13 | 5 | 0 | 0 |
|---|
|
|
|
|
| Kerewan |
|---|
|
| Jan | Feb | Mar | Apr | May | Jun | Jul | Aug | Sep | Oct | Nov | Dec |
|---|
| Min temp. | 16 | 16 | 18 | 19 | 20 | 22 | 23 | 23 | 23 | 23 | 20 | 17 |
|---|
| Max temp. | 34 | 36 | 38 | 39 | 38 | 36 | 33 | 32 | 32 | 34 | 35 | 35 |
|---|
| Precip. | 0 | 0 | 0 | 0 | 0 | 80 | 195 | 295 | 225 | 75 | 0 | 0 |
|---|
| Prec. days | 0 | 0 | 0 | 0 | 0 | 4 | 12 | 16 | 14 | 5 | 0 | 0 |
|---|
|
|
|
|
See also the
temperatures month by month