Select units of measurement for the temperature and rainfall tables (metric or imperial).
Average weather, temperature, rainfall, sunshine
In Guinea, there is a
tropical climate, with a dry season in winter, and a rainy season in summer due to the south-west African monsoon.
Precipitation is more abundant along the coast, where up to 4,000 millimeters (155 inches) of rain fall in a year, while it's less abundant in the north and the north-east, where it's slightly above 1,000 mm (40 in) per year.
Although the rains are heavier on the coast, the rainy season lasts longer in the south-east, where the first showers occur as early as in the second half of February, and the last ones occur in November, while in Conakry, on the coast, the rains occur from May to November, and in Kankan, in the east, from May to October.
Winter, from December to February, is hot, dry and sunny, with the prevalence of the north-east wind, called
Harmattan, which can carry dust and sand particles from the desert. Nights are usually cool, especially in the interior, while during the day the temperature is high, around 32/34 °C (90/93 °F), but with peaks of 40 °C (104 °F). By February, the first showers occur in the south, while in the center and north the heat becomes even more intense.
The
increase in temperature in spring is less pronounced along the coast, which is mitigated by the ocean breeze, but also in the south-central inland areas, both because of the higher altitude and the fact that the monsoon arrives earlier.
In the
rainy season, temperatures drop and humidity rises.
The climate in detail
Inland areas
The interior of Guinea is almost everywhere occupied by
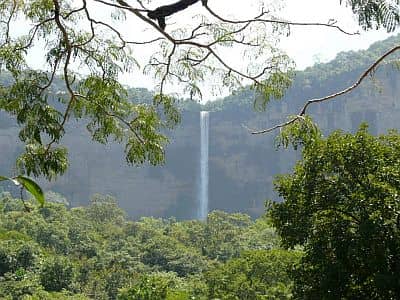
hills and low mountains, which reach at most an altitude of around 1,500 meters (5,000 feet), both in Mount Loura (in the north-west) and in Mount Nimba (in the south-east). In the mountains, some important rivers such as Niger, Senegal, and Gambia have their source.
The altitude
tempers a bit the climate, so the warmest cities are found at lower elevations.
Koundara
 Koundara
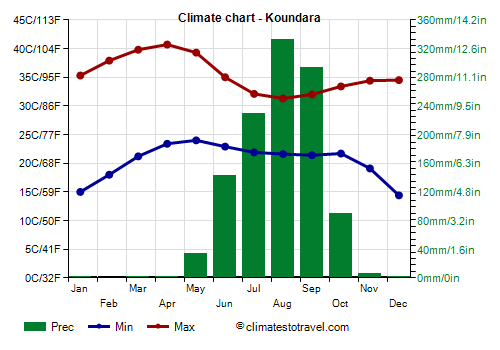
, located in the far north, at sea level, is very hot especially from March to May, before the arrival of the monsoon, when highs are normally around 38/40 °C (100/104 °F). We are in the
hottest area of Guinea.
As mentioned, the north is the least rainy area of country; moreover, the rainy season is shorter.
In the far north, the sun shines regularly in the long dry season, but all in all, it is seen quite often also from July to September.
N'Zerekoré

In
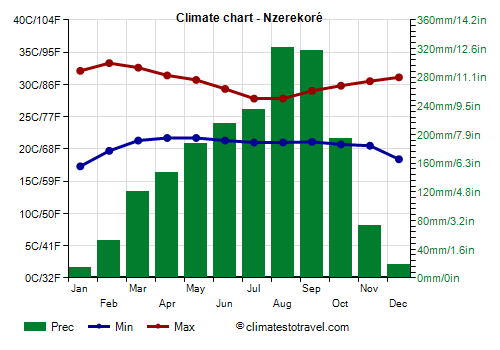
N'Zerekoré, located in the south-east, in the so-called Guinée forestière, at 500 meters (1,600 feet) above sea level, the climate is
less hot, both for the altitude and for the greater rainfall. Indeed, the average daytime temperature does not go above 33 °C (92 °F) in February and March.
As mentioned, the south-east is the area where the rainy season is longer.
In the south, the sun shines less often than in the north, even in the dry season, which, however, is still quite sunny.

The coast
Conakry

The capital,
Conakry, lying on the coast, has a
hot and humid climate, with little variation in temperatures throughout the year. In winter, highs are around 31/32 °C (88/90 °F), while in the rainy season they drop to 28/29 °C (82/84 °F), although the higher humidity makes the heat muggy (but at least, on the coast the heat is tempered by the breeze).
Conakry is
the rainiest city of Guinea: the majority of the 4 meters (13 feet) of rain that fall in a year, occurs from June to mid-October. In particular, there is torrential rainfall in July and August, when it rains almost every day.
In Conakry, the sun shines quite often from November to April, while in the rainy season, and especially from July to September, the sky is often cloudy. In addition to being the rainiest area, that of the capital is also
the least sunny of the country.
The
sea in Guinea is warm enough for swimming all year round, in fact the water temperature goes from 26.5 °C (79.5 °F) in March to 28.5 °C (83.5 °F) in June.
When to go
The best time to visit Guinea is
winter, in particular in December and January. The weather is good, although it can get hot during the day, especially in inland areas and at lower altitudes, while it can get cool at night, especially in the mountains.
Before the arrival of the monsoon, from March to May, it becomes very hot in inland regions, especially in the north, while on the coast the temperature is more stable. On the contrary, in the south the rains begin to fall.
The best period for a
beach holiday runs from December to April, since it's the dry season.
What to pack
In
winter: in Conakry and along the coast, bring light clothes for the day, a light sweatshirt for the evening, a scarf for the wind-borne sand and dust. In inland areas, it may be useful to bring a sweatshirt and a jacket for the evening.
In
summer: bring light clothing of natural fibers, a light sweatshirt and a light raincoat for the long and heavy downpours, or an umbrella, which, however, may not be effective for tropical rains. In inland areas and mountain ranges, you can add a heavier sweatshirt or a sweater for wet and rainy days.
Climate data - Guinea
| Boké |
|---|
|
| Jan | Feb | Mar | Apr | May | Jun | Jul | Aug | Sep | Oct | Nov | Dec |
|---|
| Min temp. | 18 | 19 | 21 | 22 | 22 | 22 | 22 | 22 | 22 | 22 | 21 | 19 |
|---|
| Max temp. | 35 | 37 | 38 | 38 | 36 | 33 | 30 | 30 | 31 | 32 | 33 | 34 |
|---|
| Precip. | 0 | 0 | 0 | 5 | 100 | 240 | 495 | 595 | 460 | 380 | 55 | 0 |
|---|
| Prec. days | 0 | 0 | 0 | 0 | 5 | 14 | 22 | 24 | 22 | 20 | 4 | 0 |
|---|
|
|
|
|
| Conakry |
|---|
|
| Jan | Feb | Mar | Apr | May | Jun | Jul | Aug | Sep | Oct | Nov | Dec |
|---|
| Min temp. | 22 | 23 | 24 | 25 | 25 | 24 | 23 | 23 | 23 | 23 | 24 | 23 |
|---|
| Max temp. | 32 | 32 | 32 | 32 | 32 | 30 | 29 | 28 | 30 | 30 | 31 | 32 |
|---|
| Precip. | 0 | 0 | 5 | 20 | 110 | 435 | 1085 | 1140 | 555 | 295 | 80 | 5 |
|---|
| Prec. days | 0 | 0 | 0 | 2 | 8 | 19 | 26 | 28 | 23 | 17 | 5 | 0 |
|---|
| Humidity | 67% | 69% | 68% | 69% | 74% | 82% | 88% | 90% | 86% | 83% | 80% | 71% |
|---|
| Day length | 12 | 12 | 12 | 12 | 13 | 13 | 13 | 12 | 12 | 12 | 12 | 12 |
|---|
| Sun hours | 7 | 8 | 8 | 7 | 7 | 5 | 4 | 3 | 4 | 6 | 7 | 7 |
|---|
| Sea temp | 27 | 27 | 26 | 27 | 28 | 28 | 28 | 27 | 28 | 28 | 29 | 28 |
|---|
| Faranah (340 meters) |
|---|
|
| Jan | Feb | Mar | Apr | May | Jun | Jul | Aug | Sep | Oct | Nov | Dec |
|---|
| Min temp. | 14 | 17 | 21 | 22 | 21 | 20 | 20 | 20 | 20 | 20 | 18 | 14 |
|---|
| Max temp. | 33 | 36 | 37 | 36 | 34 | 31 | 29 | 29 | 30 | 31 | 32 | 32 |
|---|
| Precip. | 0 | 5 | 20 | 55 | 165 | 205 | 280 | 320 | 350 | 190 | 20 | 5 |
|---|
|
|
|
|
|
| Kankan (375 meters) |
|---|
|
| Jan | Feb | Mar | Apr | May | Jun | Jul | Aug | Sep | Oct | Nov | Dec |
|---|
| Min temp. | 15 | 18 | 22 | 24 | 23 | 22 | 21 | 21 | 21 | 21 | 19 | 15 |
|---|
| Max temp. | 34 | 37 | 38 | 37 | 35 | 32 | 31 | 30 | 31 | 33 | 34 | 34 |
|---|
| Precip. | 5 | 5 | 20 | 50 | 130 | 180 | 235 | 350 | 315 | 135 | 20 | 0 |
|---|
| Prec. days | 0 | 0 | 2 | 4 | 9 | 13 | 15 | 19 | 18 | 11 | 1 | 0 |
|---|
|
|
|
|
| Kindia (460 meters) |
|---|
|
| Jan | Feb | Mar | Apr | May | Jun | Jul | Aug | Sep | Oct | Nov | Dec |
|---|
| Min temp. | 20 | 21 | 22 | 22 | 22 | 21 | 21 | 21 | 21 | 21 | 21 | 20 |
|---|
| Max temp. | 32 | 35 | 36 | 35 | 33 | 30 | 28 | 27 | 29 | 30 | 31 | 32 |
|---|
| Precip. | 0 | 5 | 10 | 65 | 165 | 260 | 380 | 480 | 365 | 240 | 50 | 5 |
|---|
| Prec. days | 0 | 0 | 1 | 4 | 10 | 16 | 22 | 26 | 22 | 17 | 4 | 0 |
|---|
|
|
|
|
| Koundara |
|---|
|
| Jan | Feb | Mar | Apr | May | Jun | Jul | Aug | Sep | Oct | Nov | Dec |
|---|
| Min temp. | 15 | 18 | 21 | 23 | 24 | 23 | 22 | 22 | 21 | 22 | 19 | 14 |
|---|
| Max temp. | 35 | 38 | 40 | 41 | 39 | 35 | 32 | 31 | 32 | 33 | 34 | 34 |
|---|
| Precip. | 0 | 0 | 0 | 0 | 35 | 140 | 230 | 335 | 295 | 90 | 5 | 0 |
|---|
| Prec. days | 0 | 0 | 0 | 0 | 3 | 10 | 14 | 19 | 18 | 7 | 0 | 0 |
|---|
|
|
| Sun hours | 9 | 9 | 9 | 9 | 9 | 8 | 6 | 6 | 7 | 8 | 9 | 8 |
|---|
|
| Labé (1,025 meters) |
|---|
|
| Jan | Feb | Mar | Apr | May | Jun | Jul | Aug | Sep | Oct | Nov | Dec |
|---|
| Min temp. | 11 | 13 | 15 | 18 | 18 | 18 | 18 | 18 | 17 | 16 | 13 | 10 |
|---|
| Max temp. | 30 | 32 | 33 | 34 | 32 | 28 | 26 | 26 | 27 | 28 | 29 | 29 |
|---|
| Precip. | 0 | 5 | 5 | 40 | 150 | 240 | 300 | 380 | 255 | 155 | 35 | 0 |
|---|
| Prec. days | 0 | 0 | 1 | 4 | 10 | 17 | 20 | 24 | 20 | 14 | 2 | 0 |
|---|
|
|
|
|
| Mamou (780 meters) |
|---|
|
| Jan | Feb | Mar | Apr | May | Jun | Jul | Aug | Sep | Oct | Nov | Dec |
|---|
| Min temp. | 14 | 16 | 18 | 20 | 19 | 18 | 18 | 18 | 18 | 18 | 16 | 14 |
|---|
| Max temp. | 32 | 33 | 34 | 33 | 31 | 28 | 27 | 26 | 27 | 29 | 30 | 31 |
|---|
| Precip. | 5 | 5 | 20 | 80 | 150 | 220 | 315 | 425 | 330 | 200 | 45 | 0 |
|---|
|
|
|
|
|
| Nzerekoré (500 meters) |
|---|
|
| Jan | Feb | Mar | Apr | May | Jun | Jul | Aug | Sep | Oct | Nov | Dec |
|---|
| Min temp. | 17 | 20 | 21 | 22 | 22 | 21 | 21 | 21 | 21 | 21 | 20 | 18 |
|---|
| Max temp. | 32 | 33 | 33 | 31 | 31 | 29 | 28 | 28 | 29 | 30 | 30 | 31 |
|---|
| Precip. | 15 | 50 | 120 | 145 | 185 | 215 | 235 | 320 | 315 | 195 | 75 | 20 |
|---|
| Prec. days | 1 | 4 | 9 | 11 | 14 | 15 | 17 | 22 | 22 | 16 | 8 | 2 |
|---|
|
|
| Sun hours | 8 | 8 | 7 | 7 | 7 | 6 | 4 | 4 | 5 | 7 | 7 | 7 |
|---|
|
See also the
temperatures month by month