Select units of measurement for the temperature and rainfall tables (metric or imperial).
Average weather, temperature, rainfall, sunshine
In Mauritania, the climate is
hot and desert in the center-north, while it is
semi-desert in the south because of the summer monsoon, which brings some rainfall between June and early October.
On the
coast, the heat is tempered by sea breezes, but the climate is mild only in the northernmost part, which is also affected by a
cool sea current.
Across the country, the wind can bring sandstorms.
The climate in detail
The desert
The north (zone 1 on the map) is occupied by the western part of the
Sahara desert, where it almost never rains.
Nouadhibou
As mentioned, however, a
cold current flows along the coast, at least for the latitude (in fact we are south of the Tropic).
In
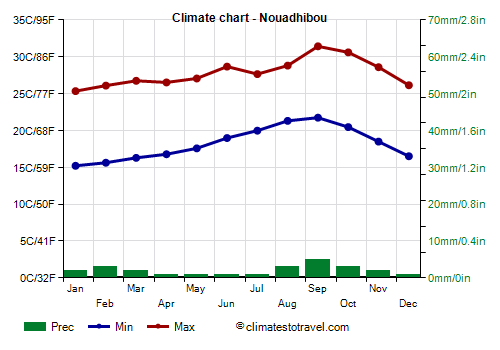
Nouadhibou, located in the north, near the border with Western Sahara, the air is often mild or pleasantly warm.
The daily average is about 20 °C (68 °F) in winter, when there are frequent
morning mists, it is still about 24 °C (75 °F) in July, and reaches 26.5 °C (80 °F) in September, which is the warmest month.
However, when the
wind blows from the desert, the temperature can rise by several degrees and reach 37/38 °C (99/100 °F) in much of the year (except in winter), although these heatwaves are less intense than in the rest of the country. The months when hot days are more frequent are September and October.
Rainfall in Nouadhibou is definitely scarce, since it does not even reach 30 millimeters (1.2 inches) per year.
The sun shines all year round, though a little less than in inland areas on account of morning fogs and mists.
As mentioned, the
sea in this northern part of the coast is
very cool for much of the year, while it becomes warm enough to swim in from August to October.
In the
northern inland areas, we are instead in full desert. Here, winter is cooler, with daytime temperatures around 22/23 °C (72/73 °F) in January, while the warmest months are the "canonical" ones, ie July and August, with highs around 40/42 °C (104/108 °F).
The hottest area is the north-east, where the temperature in summer can sometimes reach 50 °C (122 °F). The rains are definitely scarce.
Zouérat
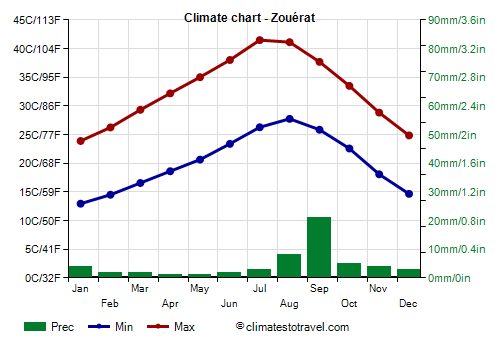
In Zouérat, located in the north, near the border with Western Sahara, and 350 meters (1,150 feet) above sea level, the average temperature ranges from 18.5 °C (65 °F) in January to 34.5 °C (94 °F) in August.
In Zouérat, it almost never rains: in a year, 55 mm (2.1 in) of rain fall, with a maximum of 20 mm (0.8 in) in September.
In the desert, the sun shines all year round; however, there is a slight decrease in the sunshine hours in summer, when sometimes there may be some cloudiness.
The Sahel
The south-central region is that of the
Sahel (zone 2), which, in the summer months, is affected by the northern offshoots of the African
monsoon, which brings clouds and rains from the Atlantic Ocean.
Nouakchott
The Mauritanian capital,
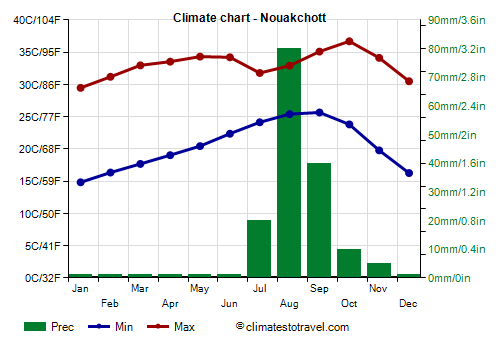
Nouakchott, located in the central-southern part of the coast, is warm all year round. In winter, from December to February, highs remain around 29/30 °C (84/86 °F), but nights are cool. In addition, the
Harmattan, the dry north-east wind, often blows in winter, carrying dust and sand.
In March, the temperature increases, though not as much as in the rest of the country, thanks to the influence of the ocean. However, the daytime temperature rises to 34 °C (93 °F) in May and June.
Even on the coast, the temperature can reach 45 °C (113 °F) when the wind blows from inland, which can also cause sandstorms.
From July to October, the African monsoon reaches southern Mauritania. In this central belt which includes the capital, the effects are limited, however, sometimes a bit of cloudiness and of rain can arrive. Finally, by mid-November, with winter approaching, the temperature starts to decline.
The cool sea current has evident effects even at Nouakchott for most of the year, in fact, the
sea temperature remains very cool from January to May. On the other hand, from August to October the sea becomes pleasantly warm.
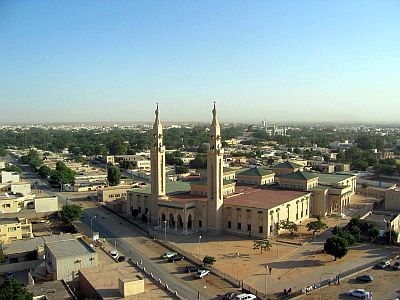
East of the capital, owing to the distance from the sea, the heat is more intense for most of the year, apart from the winter months. In
Tidjikja, at 400 meters (1,300 feet) of altitude, the daytime temperature in June is normally about 41 °C (106 °F); annual precipitation amounts to 130 mm (5.1 in).
Kiffa
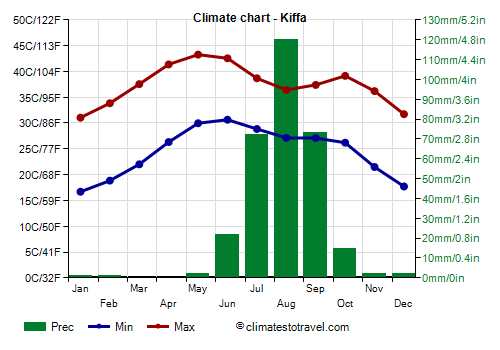
In the
south, the winter is even warmer than in Nouakchott: night-time temperatures are around 16/17 °C (61/63 °F), while highs are around 28/30 °C (82/86 °F).
In
Kiffa, located in the south of the country, 500 kilometers (310 miles) away from the sea, the average temperature ranges from 24 °C (75 °F) in January to 36.5 °C (97.5) in May and June.
In this area, the heat begins to increase already in February, and in May, highs of 42/43 °C (108/109 °F) are normal, but the summer monsoon is more intense, so much so that rainfall is between 200 and 400 mm (8 and 16 in) per year.
In
Néma, 110 mm (4.3 in) of rain fall in August, and in Kiffa, 130 mm (5.1 in). The combination of moisture and temperature, which remains around 36 °C (97 °F) during the rainy months, makes the heat definitely uncomfortable.
Far south
In the
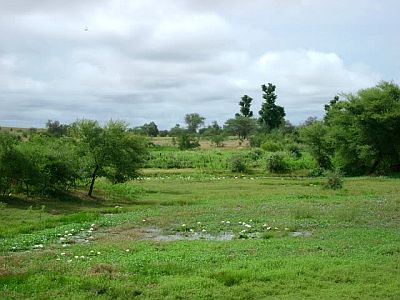
far south, along the border with Senegal (zone 3 on the map), the summer rains are even more abundant, so much so that the total is between 400 and 600 mm (16 to 23.5 in) per year. We are still in the Sahel, but in the climatic subdivision called "Sudanese", where even more than 200 mm (8 in) of rain can fall in August, and in the rainy season, the landscape changes, becoming definitely green; in Mauritania, this happens especially in the southernmost region, called Guidimakha.
Sélibaby
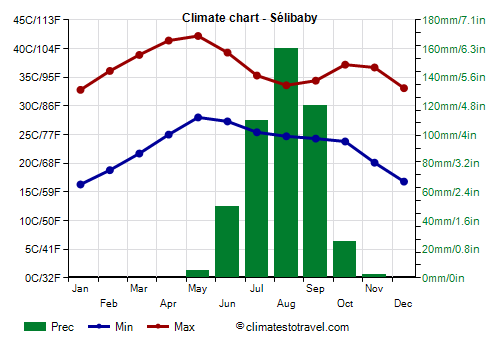
In the extreme south, winter is hot, and daytime temperatures exceed 30 °C (86 °F) even in December and January. Already in February, the temperature exceeds 35 °C (95 °F), while spring is scorching, but then, the decrease in summer is evident. In
Sélibaby, the capital of the Guidimaka Region, in July the average temperature is 30 °C (86 °F), compared to 35 °C (95 °F) in May.
In Sélibaby there are three months with more than 100 mm (4 in) of rain, July, August and September, and the annual total is 475 mm (18.7 in).
When to go
The best time to visit Mauritania is
winter, from December to mid-February: temperatures are hot in the south and mild in the north, the sun shines and it almost never rains. At night, it can get a bit cold everywhere, quite often in the inland areas of the north, and rarely in the south. In the south, it can sometimes get hot even in this season, but more rarely than in the rest of the year.
In winter, it is possible to swim, even though the
sea is a bit cool, and sometimes, the air can be cold, at least at night and in the early hours of the morning.
What to pack
In
winter: for the inland areas, bring light clothing, long and loose-fitting shirts and pants, a scarf for the sand and dust, sunglasses (even graduated instead of contact lenses), a jacket and a sweater for the evening, especially in the north, and desert boots or sandals; for Nouakchott and the coast, light clothes for the day, a sweatshirt and a jacket for the evening, and a scarf for the sand.
In
summer: bring lightweight clothes, long and made of natural fabric (cotton or linen), a desert turban, a sweatshirt for the night, a sleeping bag for night outdoors. On the coast north of Nouakchott, a light sweatshirt; for the south, a light raincoat for the rain showers. It's better for women to avoid shorts and miniskirts.
Climate data - Mauritania
| Atar (225 meters) |
|---|
|
| Jan | Feb | Mar | Apr | May | Jun | Jul | Aug | Sep | Oct | Nov | Dec |
|---|
| Min temp. | 15 | 17 | 20 | 22 | 27 | 29 | 30 | 30 | 29 | 25 | 21 | 17 |
|---|
| Max temp. | 28 | 30 | 33 | 36 | 40 | 42 | 42 | 41 | 40 | 37 | 33 | 29 |
|---|
| Precip. | 0 | 5 | 0 | 0 | 0 | 0 | 5 | 20 | 20 | 5 | 5 | 0 |
|---|
| Prec. days | 1 | 1 | 0 | 0 | 0 | 0 | 1 | 2 | 2 | 0 | 0 | 0 |
|---|
| Humidity | 35% | 31% | 30% | 30% | 30% | 31% | 33% | 34% | 32% | 26% | 33% | 36% |
|---|
| Day length | 11 | 12 | 12 | 13 | 13 | 13 | 13 | 13 | 12 | 12 | 11 | 11 |
|---|
| Sun hours | 9 | 9 | 10 | 11 | 11 | 11 | 10 | 10 | 9 | 9 | 9 | 9 |
|---|
|
| Ayoun El Atrous (230 meters) |
|---|
|
| Jan | Feb | Mar | Apr | May | Jun | Jul | Aug | Sep | Oct | Nov | Dec |
|---|
| Min temp. | 17 | 19 | 23 | 28 | 30 | 31 | 28 | 26 | 27 | 27 | 22 | 18 |
|---|
| Max temp. | 29 | 32 | 37 | 40 | 42 | 42 | 39 | 36 | 38 | 38 | 35 | 30 |
|---|
| Precip. | 0 | 0 | 0 | 0 | 0 | 15 | 70 | 90 | 45 | 10 | 0 | 0 |
|---|
| Prec. days | 1 | 0 | 0 | 1 | 1 | 1 | 2 | 4 | 3 | 1 | 1 | 0 |
|---|
| Humidity | 20% | 15% | 14% | 14% | 17% | 25% | 44% | 57% | 48% | 29% | 21% | 23% |
|---|
| Day length | 11 | 12 | 12 | 12 | 13 | 13 | 13 | 13 | 12 | 12 | 11 | 11 |
|---|
|
|
| Bir Moghrein (370 meters) |
|---|
|
| Jan | Feb | Mar | Apr | May | Jun | Jul | Aug | Sep | Oct | Nov | Dec |
|---|
| Min temp. | 11 | 13 | 15 | 16 | 18 | 21 | 24 | 25 | 23 | 20 | 16 | 12 |
|---|
| Max temp. | 23 | 26 | 29 | 31 | 33 | 36 | 41 | 41 | 37 | 37 | 32 | 28 |
|---|
| Precip. | 0 | 0 | 0 | 0 | 0 | 0 | 0 | 5 | 10 | 10 | 5 | 5 |
|---|
| Prec. days | 1 | 1 | 1 | 0 | 0 | 0 | 0 | 0 | 1 | 0 | 1 | 1 |
|---|
| Humidity | 45% | 44% | 41% | 42% | 40% | 37% | 33% | 33% | 38% | 44% | 46% | 48% |
|---|
| Day length | 11 | 11 | 12 | 13 | 13 | 14 | 14 | 13 | 12 | 12 | 11 | 11 |
|---|
|
|
| Kiffa |
|---|
|
| Jan | Feb | Mar | Apr | May | Jun | Jul | Aug | Sep | Oct | Nov | Dec |
|---|
| Min temp. | 17 | 19 | 22 | 26 | 30 | 31 | 29 | 27 | 27 | 26 | 22 | 18 |
|---|
| Max temp. | 31 | 34 | 38 | 41 | 43 | 43 | 39 | 36 | 37 | 39 | 36 | 32 |
|---|
| Precip. | 0 | 0 | 0 | 0 | 0 | 20 | 70 | 120 | 75 | 15 | 0 | 0 |
|---|
| Prec. days | 1 | 1 | 0 | 0 | 1 | 1 | 2 | 3 | 2 | 1 | 1 | 1 |
|---|
|
|
|
|
| Nouadhibou |
|---|
|
| Jan | Feb | Mar | Apr | May | Jun | Jul | Aug | Sep | Oct | Nov | Dec |
|---|
| Min temp. | 15 | 16 | 16 | 17 | 18 | 19 | 20 | 21 | 22 | 20 | 18 | 17 |
|---|
| Max temp. | 25 | 26 | 27 | 27 | 27 | 29 | 28 | 29 | 31 | 31 | 29 | 26 |
|---|
| Precip. | 0 | 5 | 0 | 0 | 0 | 0 | 0 | 5 | 5 | 5 | 0 | 0 |
|---|
| Prec. days | 0 | 0 | 0 | 0 | 0 | 0 | 0 | 0 | 1 | 0 | 0 | 0 |
|---|
| Humidity | 57% | 62% | 68% | 72% | 72% | 74% | 79% | 79% | 72% | 69% | 63% | 59% |
|---|
| Day length | 11 | 12 | 12 | 13 | 13 | 13 | 13 | 13 | 12 | 12 | 11 | 11 |
|---|
| Sun hours | 8 | 8 | 9 | 10 | 10 | 9 | 8 | 9 | 8 | 8 | 8 | 8 |
|---|
| Sea temp | 19 | 19 | 19 | 19 | 19 | 20 | 22 | 24 | 25 | 24 | 22 | 21 |
|---|
| Nouakchott |
|---|
|
| Jan | Feb | Mar | Apr | May | Jun | Jul | Aug | Sep | Oct | Nov | Dec |
|---|
| Min temp. | 15 | 16 | 18 | 19 | 20 | 22 | 24 | 25 | 26 | 24 | 20 | 16 |
|---|
| Max temp. | 29 | 31 | 33 | 34 | 34 | 34 | 32 | 33 | 35 | 37 | 34 | 30 |
|---|
| Precip. | 0 | 0 | 0 | 0 | 0 | 0 | 20 | 80 | 40 | 10 | 5 | 0 |
|---|
| Prec. days | 0 | 0 | 0 | 0 | 0 | 1 | 2 | 4 | 4 | 1 | 1 | 0 |
|---|
| Humidity | 32% | 37% | 45% | 54% | 57% | 63% | 74% | 75% | 69% | 53% | 42% | 36% |
|---|
| Day length | 11 | 12 | 12 | 13 | 13 | 13 | 13 | 13 | 12 | 12 | 11 | 11 |
|---|
| Sun hours | 8 | 8 | 8 | 9 | 9 | 8 | 8 | 8 | 8 | 8 | 8 | 7 |
|---|
| Sea temp | 20 | 20 | 20 | 20 | 20 | 22 | 25 | 26 | 27 | 26 | 24 | 22 |
|---|
| Sélibaby |
|---|
|
| Jan | Feb | Mar | Apr | May | Jun | Jul | Aug | Sep | Oct | Nov | Dec |
|---|
| Min temp. | 16 | 19 | 22 | 25 | 28 | 27 | 25 | 25 | 24 | 24 | 20 | 17 |
|---|
| Max temp. | 33 | 36 | 39 | 41 | 42 | 39 | 35 | 34 | 34 | 37 | 37 | 33 |
|---|
| Precip. | 0 | 0 | 0 | 0 | 5 | 50 | 110 | 160 | 120 | 25 | 0 | 0 |
|---|
| Prec. days | 0 | 0 | 0 | 0 | 2 | 5 | 10 | 11 | 9 | 3 | 0 | 0 |
|---|
|
|
| Sun hours | 9 | 10 | 10 | 10 | 10 | 9 | 9 | 8 | 9 | 9 | 10 | 8 |
|---|
|
| Tidjikja (400 meters) |
|---|
|
| Jan | Feb | Mar | Apr | May | Jun | Jul | Aug | Sep | Oct | Nov | Dec |
|---|
| Min temp. | 14 | 16 | 20 | 23 | 27 | 29 | 28 | 27 | 27 | 25 | 19 | 17 |
|---|
| Max temp. | 27 | 30 | 34 | 38 | 40 | 41 | 40 | 38 | 38 | 37 | 33 | 29 |
|---|
| Precip. | 0 | 0 | 0 | 0 | 5 | 10 | 20 | 50 | 30 | 10 | 0 | 0 |
|---|
| Prec. days | 0 | 1 | 0 | 1 | 0 | 1 | 2 | 3 | 2 | 0 | 1 | 0 |
|---|
| Humidity | 25% | 22% | 21% | 19% | 20% | 24% | 36% | 46% | 40% | 30% | 26% | 23% |
|---|
| Day length | 11 | 12 | 12 | 13 | 13 | 13 | 13 | 13 | 12 | 12 | 11 | 11 |
|---|
|
|
| Zouérat (350 meters) |
|---|
|
| Jan | Feb | Mar | Apr | May | Jun | Jul | Aug | Sep | Oct | Nov | Dec |
|---|
| Min temp. | 13 | 15 | 17 | 19 | 21 | 23 | 26 | 28 | 26 | 23 | 18 | 15 |
|---|
| Max temp. | 24 | 26 | 29 | 32 | 35 | 38 | 41 | 41 | 38 | 34 | 29 | 25 |
|---|
| Precip. | 5 | 0 | 0 | 0 | 0 | 0 | 5 | 10 | 20 | 5 | 5 | 5 |
|---|
|
|
|
| Sun hours | 9 | 9 | 10 | 11 | 11 | 10 | 10 | 10 | 9 | 9 | 9 | 8 |
|---|
|
See also the
temperatures month by month