Select units of measurement for the temperature and rainfall tables (metric or imperial).
Average weather, temperature, rainfall, sunshine
In the Federated States of Micronesia, the climate is
equatorial, ie hot, humid and rainy throughout the year.
The islands are located on the Pacific Ocean north of the equator, over an area 2,800 kilometers (1,700 miles) long, and are affected by the
trade winds, constant winds that are able to temper a bit the heat.
From a geographical point of view, they are called
Caroline Islands, together with the islands of Palau. The country is divided into four states, from west to east, Yap, Chuuk, Pohnpei and Kosrae.
The
temperature is definitely stable throughout the year, around 23/25 °C (73/77 °F) at night and 30/32 °C (86/90 °F) during the day. Given the enormous distance from the continents, the fluctuations compared to the averages are very limited, in fact, temperature very rarely drops below 20 °C (68 °F), while it can sometimes reach 34/35 °C (93/95 °F).
Annual
rainfall is abundant, and ranges from 2,500 to 5,000 millimeters (100 to 200 inches). However, on the windward slopes of the larger islands (such as Pohnpei and Kosrae), which host some elevations in the interior, rainfall can exceed 6,000 mm (235 in) per year, that is, as high as six meters (20 feet)! Mount Nahnalaud, 750 meters (2,450 ft) high, on the island of Pohnpei, is one of the wettest places on Earth, with 10,160 mm (400 in) of rain per year, and it is often covered with clouds.
Given the frequent rains, the amount of
sunshine is never excellent on average, but it is neither too low, in fact, the rains occur in the form of intense but short showers and thunderstorms. However, the sun tends to be more frequent in the less rainy months.
The driest islands are the
flat atolls, where there are no hills and mountains which could enhance the formation of thunderclouds: in these cases, precipitation can drop below 4,000 mm (157 in) per year, and in some cases, even below 3,000 mm (118 in).
However, since the country is affected by the so-called
ENSO cycle, the rainfall pattern is quite irregular from year to year. In particular, the phenomenon known as
El Niño can cause drought in this area of the Pacific, especially in the first months of the year.
The climate in detail
The islands
Palikir

In the capital,
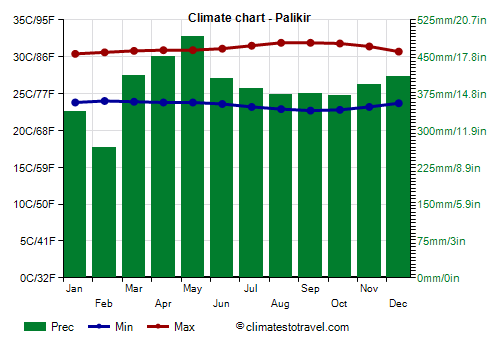
Palikir, located at 7 degrees north latitude, on the island of Pohnpei (ex Ponape), temperatures are very stable, however, during the day, they are slightly higher from August to October and slightly lower in January and February.
The temperature almost never drops below 20 °C (68 °F) at night and almost never exceeds 35 °C (95 °F) during the day.
Palikir is
the wettest capital in the world, and receives almost 4,650 mm (183 in) of rain per year, with a minimum of 285 mm (11.2 in) in February and a maximum of 490 mm (19.2 in) in May.
The
sea in Micronesia is pleasantly warm all year round, and has a very stable temperature.

Yap

In
Yap too, the westernmost island, located at 9 degrees north latitude, temperatures are very stable and high throughout the year as well.
Here, 3,135 mm (123 in) of rain fall per year. The period from February to April is (relatively) less rainy, since rainfall does not exceed 160 mm (6.3 in) per month, which, however, is still a considerable amount.
The sun in Yap shines more often in the first months of the year, ie in the least rainy period.
In Yap too, the sea is warm all year round.
Weno

The state of
Chuuk (called Truk until 1990), is located further to the east, between Yap and Pohnpei. In
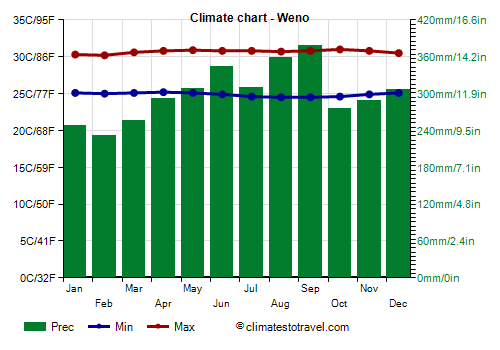
Weno too, the state capital and largest city of the country, located at 7 degrees north latitude, the temperatures are very stable and high throughout the year.
In Weno, rainfall amounts to 3,600 mm (142 in) per year. The least rainy period is from January to March, in which, however, rainfall does not drop below 200 mm (8 in) per month.
Here, too, the sea is warm all year round.
In the southern atoll of
Kapingamarangi, located just 1 degree north of the Equator, rainfall amounts to 3,000 mm (118 in), and it drops below 250 mm (10 in) from August to December, and below 200 mm (8 in) in September and October.
Tropical cyclones
Micronesia can be affected by the
tropical cyclones of the North Pacific Ocean, known in this area as typhoons. Typically, typhoons occur from April to December, although they are more frequent between August and November. However, since the sea is always warm, they can sometimes also occur from January to March, although tropical depressions that are formed during this period are usually not intense.
An exception is represented by the southern atoll of Kapingamarangi, which is sheltered from typhoons because it's located practically at the Equator (or at worst, it can be affected in a marginal way).
When to go
The best times to visit Micronesia are the driest ones (or rather the least rainy):
from February to April on the westernmost islands (Yap Islands) and
from January to March on the central-eastern islands (Eastern Caroline Islands). Typically,
February is the least rainy month of all.
What to pack
All year round, bring tropics-friendly, loose-fitting clothing, a sun hat, a scarf for the breeze, a light sweatshirt for the evening, a light raincoat or umbrella.
Climate data - Micronesia
| Kapingamarangi |
|---|
|
| Jan | Feb | Mar | Apr | May | Jun | Jul | Aug | Sep | Oct | Nov | Dec |
|---|
| Min temp. | 24 | 24 | 24 | 24 | 24 | 25 | 24 | 24 | 24 | 24 | 24 | 24 |
|---|
| Max temp. | 31 | 31 | 31 | 31 | 31 | 31 | 31 | 31 | 32 | 32 | 31 | 31 |
|---|
| Precip. | 260 | 275 | 330 | 320 | 285 | 270 | 295 | 225 | 195 | 170 | 210 | 235 |
|---|
| Prec. days | 18 | 16 | 20 | 19 | 20 | 19 | 19 | 18 | 15 | 14 | 15 | 17 |
|---|
|
|
|
|
| Kosrae |
|---|
|
| Jan | Feb | Mar | Apr | May | Jun | Jul | Aug | Sep | Oct | Nov | Dec |
|---|
| Min temp. | 23 | 23 | 23 | 23 | 23 | 23 | 23 | 23 | 23 | 23 | 23 | 23 |
|---|
| Max temp. | 31 | 31 | 31 | 31 | 31 | 31 | 31 | 32 | 32 | 32 | 31 | 31 |
|---|
| Precip. | 440 | 380 | 405 | 510 | 485 | 410 | 410 | 385 | 375 | 305 | 365 | 510 |
|---|
| Prec. days | 21 | 19 | 23 | 24 | 25 | 24 | 24 | 22 | 21 | 19 | 20 | 22 |
|---|
|
|
|
|
| Palikir |
|---|
|
| Jan | Feb | Mar | Apr | May | Jun | Jul | Aug | Sep | Oct | Nov | Dec |
|---|
| Min temp. | 24 | 24 | 24 | 24 | 24 | 24 | 23 | 23 | 23 | 23 | 23 | 24 |
|---|
| Max temp. | 30 | 31 | 31 | 31 | 31 | 31 | 32 | 32 | 32 | 32 | 31 | 31 |
|---|
| Precip. | 340 | 265 | 410 | 450 | 490 | 405 | 385 | 375 | 375 | 370 | 395 | 410 |
|---|
| Prec. days | 19 | 17 | 21 | 22 | 23 | 22 | 23 | 21 | 20 | 21 | 21 | 22 |
|---|
|
|
|
| Sea temp | 29 | 29 | 29 | 29 | 29 | 29 | 29 | 30 | 30 | 30 | 30 | 29 |
|---|
| Weno |
|---|
|
| Jan | Feb | Mar | Apr | May | Jun | Jul | Aug | Sep | Oct | Nov | Dec |
|---|
| Min temp. | 25 | 25 | 25 | 25 | 25 | 25 | 25 | 24 | 24 | 25 | 25 | 25 |
|---|
| Max temp. | 30 | 30 | 31 | 31 | 31 | 31 | 31 | 31 | 31 | 31 | 31 | 30 |
|---|
| Precip. | 250 | 230 | 255 | 290 | 310 | 345 | 310 | 360 | 380 | 275 | 290 | 305 |
|---|
| Prec. days | 16 | 15 | 16 | 17 | 21 | 22 | 21 | 20 | 20 | 19 | 20 | 20 |
|---|
|
|
|
| Sea temp | 29 | 29 | 29 | 29 | 29 | 29 | 29 | 30 | 30 | 30 | 30 | 29 |
|---|
| Woleai |
|---|
|
| Jan | Feb | Mar | Apr | May | Jun | Jul | Aug | Sep | Oct | Nov | Dec |
|---|
| Min temp. | 24 | 24 | 24 | 24 | 24 | 24 | 23 | 23 | 23 | 24 | 23 | 24 |
|---|
| Max temp. | 31 | 31 | 31 | 31 | 31 | 31 | 31 | 31 | 31 | 32 | 32 | 31 |
|---|
| Precip. | 175 | 165 | 210 | 205 | 265 | 295 | 295 | 335 | 280 | 240 | 200 | 230 |
|---|
| Prec. days | 15 | 13 | 14 | 16 | 18 | 21 | 19 | 18 | 18 | 16 | 16 | 18 |
|---|
|
|
|
|
| Yap |
|---|
|
| Jan | Feb | Mar | Apr | May | Jun | Jul | Aug | Sep | Oct | Nov | Dec |
|---|
| Min temp. | 24 | 24 | 24 | 24 | 24 | 24 | 24 | 24 | 24 | 24 | 24 | 24 |
|---|
| Max temp. | 31 | 31 | 31 | 32 | 32 | 31 | 31 | 31 | 31 | 31 | 31 | 31 |
|---|
| Precip. | 200 | 150 | 145 | 155 | 230 | 310 | 380 | 375 | 370 | 320 | 235 | 260 |
|---|
| Prec. days | 16 | 14 | 13 | 14 | 17 | 21 | 21 | 21 | 20 | 19 | 20 | 18 |
|---|
|
|
| Sun hours | 7 | 8 | 8 | 8 | 8 | 7 | 6 | 6 | 6 | 6 | 6 | 6 |
|---|
| Sea temp | 28 | 28 | 28 | 29 | 29 | 30 | 29 | 29 | 29 | 29 | 29 | 29 |
|---|
See also the
temperatures month by month