Select units of measurement for the temperature and rainfall tables (metric or imperial).
Average weather, temperature, rainfall, sunshine
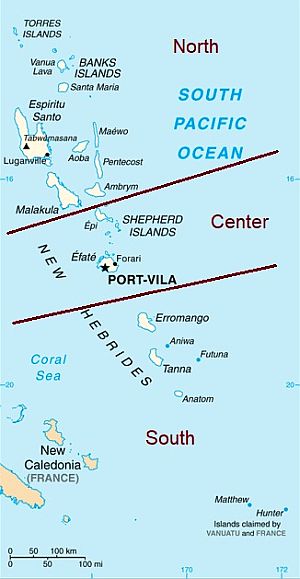
In Vanuatu (formerly New Hebrides), the climate is influenced by the trade winds, and it's
equatorial on the northern islands, ie hot and rainy all year round, while it's
tropical on the central and southern islands, with a hot and rainy season from December to March and a cool and drier season from May to October.
In fact, the islands are scattered in the Pacific Ocean south of the Equator, over an axis oriented from north to south, about 900 kilometers (550 miles) long; the southernmost islands are located at a latitude of 20 degrees south (but there are also two small uninhabited islands, Matthew and Hunter, which are at the 22nd parallel).
Many islands are volcanic, and have elevations in the interior which enhance
precipitation. The rains are most abundant on the northernmost islands, where up to 4,000 millimeters (157 inches) of rain fall per year (see Vanua Lava), including 200 mm (8 in) per month even in the least rainy months (which are July and August) and more than 450 mm (17.5 in) in March (the rainiest month). Proceeding south, the rains gradually decrease, down to 2,200/2,500 mm (80/100 in) on the southernmost islands, even though they go down to 1,500 mm (60 in) on the smallest and flat islands.
The rains occur in the form of intense downpours, which do not last long, so the sun comes out again after a while.
The period from
December to March is hot, humid, and rainy across the country, with highs around 29/31 °C (84/88 °F) and lows around 23/25 °C (73/77 °F).
Instead, the
May-October period gradually gets cooler as you head south.
The climate in detail
North
The northern islands are divided into four provinces: Torba (an acronym based on the initial letters of the Torres Islands and the Banks Islands), Sanma (which includes Espiritu Santo, the largest island of Vanuatu), Malampa (which includes Malakula, the second largest island), and Penama.
Vanua Lava
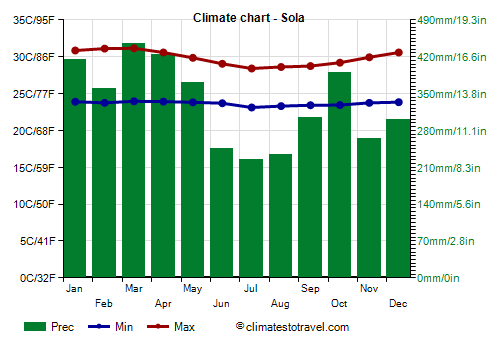
The winter season, from July to September, is warm on the northern islands, with highs around 28/29 °C (82/84 °F), for example in
Sola, on the island of Vanua Lava, belonging to the Banks Islands and located at almost 14 degrees south latitude.
The rains in Vanua Lava are abundant throughout the year, as generally happens on the northern islands having an equatorial climate, although they decrease slightly in the austral winter.
On the northern islands, the
sea is warm enough to swim in all year round.
Moving south, the winter becomes gradually cooler; however, on the islands of Espiritu Santo (see Luganville) and Malakula, the minimum temperature remains above 20 °C (68 °F) even in the coolest months.
Center-South
In the center of Vanuatu we find the province of Shefa, an acronym based on the Shepherd islands, as well as Epi and Efate. In the south we find the province of Tafea, an acronym based on the islands of Tanna, Aneityum, Futuna, Erromango and Aniwa.
On the central islands, the daytime temperature in winter is around 27 °C (81 °F), while on the southern islands, it drops to 25/26 °C (77/79 °F). At night, on these islands of the center and the south, the average temperatures are around 17/18 °C (63/64 °F), moreover, there may be
cool periods, in which they drop to 12/13 °C (54/55 °F).
Port Vila
The capital,
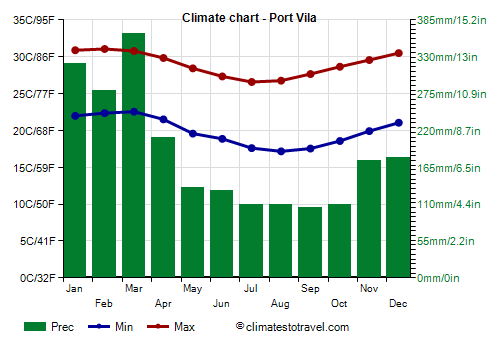
Port Vila, is located on the central island of Efate, at almost 14 degrees south latitude. Here, in July and August the daily average drops to 22 °C (71.5 °F).
In Port Vila, and in general on the central and southern islands, the decrease in rainfall from May to October is evident, even though it remains above 100 mm (4 in) per month.
The amount of sunshine in Port Vila, and in general in Vanuatu, is not great but it's neither poor: the sun often shines, but some cloudiness, maybe associated with showers and thunderstorms, is always possible.
The
sea remains quite warm to swim in also on the central islands, where the sea temperature drops to 26 °C (79 °F) from June to October.
Aneityum
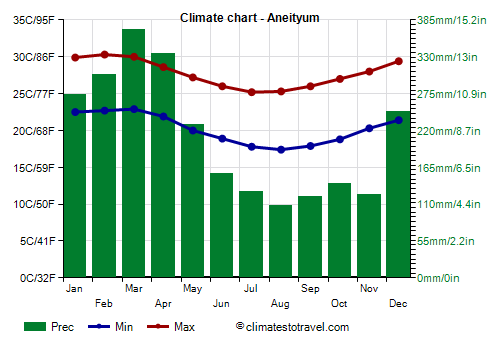
On the southernmost islands, the winter is even cooler. For instance, in Aneityum (or Keamu), the southernmost island of Vanuatu, located in the province of Tafea, the average daily temperature drops to 21.5 °C (70.5 °F) in July and August, with highs of 25 °C (77 °F).
On average, 2,600 mm (102 in) of rain fall per year.
On the southernmost islands, the sea is cooler as well, though it's still warm enough for swimming, in fact, the water temperature drops to 24 °C (75 °F) from July to October.
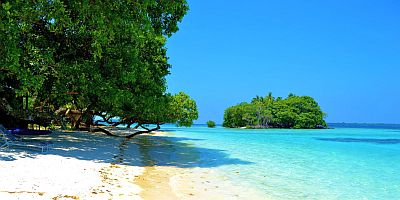
Tropical cyclones
The Vanuatus are affected by
tropical cyclones. Cyclones are usually formed from November to mid-May, though they are most likely from late December to early April. Outside of this period, there has been Cyclone Xavier, which brushed the northern islands in late October 2006. A particularly intense cyclone was Pam, which hit the islands in March 2015.
When to go
On the
northern islands of Vanuatu (down to Espiritu Santo and Malakula), the best time is from July to September, since it is the least hot and rainy period of the year.
On the
central and southern islands, which include the capital, the best time is from May to October. Considering that, on these islands, it can get cool from June to September, you may prefer the period mid-May to mid-June, and even more the month of October, when it's a bit warmer, and heavy rains are still to come.
Even in the least rainy months, however, there is no lack of showers, especially on the northernmost islands.
What to pack
In
winter (June to August): pack light clothes for the day, a scarf for the breeze, a sweatshirt for the evening, and possibly a light jacket on the southern islands; a light raincoat or umbrella. When going to the reef, you can bring snorkeling equipment, including water shoes or rubber-soled shoes.
In
summer (December to February): pack tropics-friendly, loose-fitting clothing, a sun hat, a scarf for the breeze, a light sweatshirt for the evening, and a light raincoat or umbrella.
Climate data - Vanuatu
| Aneityum |
|---|
|
| Jan | Feb | Mar | Apr | May | Jun | Jul | Aug | Sep | Oct | Nov | Dec |
|---|
| Min temp. | 22 | 23 | 23 | 22 | 20 | 19 | 18 | 17 | 18 | 19 | 20 | 21 |
|---|
| Max temp. | 30 | 30 | 30 | 29 | 27 | 26 | 25 | 25 | 26 | 27 | 28 | 29 |
|---|
| Precip. | 275 | 305 | 370 | 335 | 230 | 155 | 130 | 110 | 120 | 140 | 125 | 250 |
|---|
| Prec. days | 17 | 16 | 18 | 18 | 16 | 14 | 13 | 11 | 10 | 11 | 11 | 15 |
|---|
|
|
| Sun hours | 7 | 7 | 6 | 7 | 6 | 6 | 6 | 6 | 7 | 8 | 8 | 8 |
|---|
| Sea temp | 28 | 28 | 28 | 28 | 26 | 26 | 25 | 24 | 24 | 25 | 26 | 27 |
|---|
| Port Vila |
|---|
|
| Jan | Feb | Mar | Apr | May | Jun | Jul | Aug | Sep | Oct | Nov | Dec |
|---|
| Min temp. | 22 | 22 | 23 | 22 | 20 | 19 | 18 | 17 | 18 | 19 | 20 | 21 |
|---|
| Max temp. | 31 | 31 | 31 | 30 | 28 | 27 | 27 | 27 | 28 | 29 | 30 | 30 |
|---|
| Precip. | 320 | 280 | 365 | 210 | 135 | 130 | 110 | 110 | 105 | 110 | 175 | 180 |
|---|
| Prec. days | 18 | 17 | 20 | 17 | 14 | 13 | 12 | 12 | 12 | 12 | 13 | 14 |
|---|
|
|
| Sun hours | 7 | 7 | 7 | 7 | 6 | 6 | 7 | 7 | 8 | 8 | 8 | 8 |
|---|
| Sea temp | 28 | 29 | 29 | 28 | 28 | 27 | 26 | 26 | 26 | 26 | 27 | 28 |
|---|
| Sola |
|---|
|
| Jan | Feb | Mar | Apr | May | Jun | Jul | Aug | Sep | Oct | Nov | Dec |
|---|
| Min temp. | 24 | 24 | 24 | 24 | 24 | 24 | 23 | 23 | 23 | 23 | 24 | 24 |
|---|
| Max temp. | 31 | 31 | 31 | 31 | 30 | 29 | 28 | 29 | 29 | 29 | 30 | 31 |
|---|
| Precip. | 415 | 360 | 445 | 425 | 370 | 245 | 225 | 235 | 305 | 390 | 265 | 300 |
|---|
| Prec. days | 20 | 19 | 23 | 20 | 19 | 17 | 15 | 15 | 17 | 18 | 14 | 17 |
|---|
|
|
| Sun hours | 7 | 6 | 6 | 7 | 6 | 6 | 6 | 7 | 7 | 7 | 7 | 7 |
|---|
| Sea temp | 29 | 30 | 30 | 29 | 29 | 28 | 28 | 27 | 27 | 28 | 28 | 29 |
|---|
See also the
temperatures month by month