Select units of measurement for the temperature and rainfall tables (metric or imperial).
Average weather, temperature, rainfall, sunshine
The climate of Nauru (formerly Pleasant Island), a small island of the Pacific Ocean located at the Equator, is
equatorial, hot and humid throughout the year, with no dry season.

Average
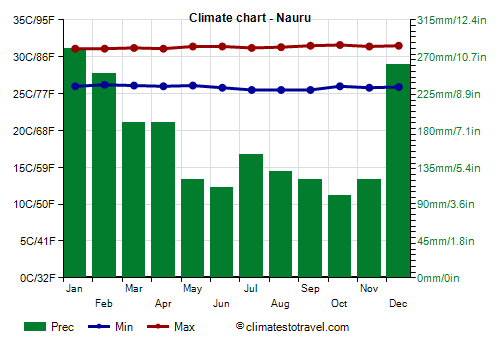
temperatures are very stable during the year: lows hover around 25.5/26 °C (78/79 °F) and highs around 31/31.5 °C (88/89 °F). Sometimes, however, the temperature can reach 33/34 °C (91/93 °F).
As for the rains, we can distinguish a
rainier period from December to April, with a maximum from December to February, and a
drier period from May to November. Precipitation amounts to around 2,000 mm (80 in) per year.
Rainfall can
vary from year to year; in fact, it can sometimes rain a lot even in the least rainy season. However, June is the month that historically has had the lowest rainfall records.
There may also be
periods of drought, in the years of La Niña, and this can create problems because there are no rivers in Nauru.
The rains occur in the form of showers or thunderstorms, which may be intense, but do not last long, so the sun has always a chance to shine.

The
sea in Nauru is pleasantly warm all year round, and has a very stable temperature too, around 29 °C (84 °F).
Cyclones
Since at the Equator there is no Coriolis effect, which is necessary to give life to cyclonic vortices, Nauru is outside of the path of tropical cyclones.
When to go
Since it is not affected by tropical cyclones, in theory, you can go to Nauru
throughout the year, however, the period from December to February is very rainy.
So, the best time to visit Nauru runs from
May to November, since it is the least rainy period of the year, though showers and thunderstorms may occur even in this period. The period from
May to August is even better because it is slightly less sultry.
The natural environment of Nauru is still suffering because of the intense mining of phosphates made in the past, and the island is not well equipped for tourism. However, the
sea lends itself to swimming and diving, and as mentioned above, it is pleasantly warm all year round.
What to pack
All year round, bring tropics-friendly, loose-fitting clothing, a sun hat, a scarf for the breeze, a light sweatshirt for the evening, and a light raincoat or umbrella.
Climate data - Nauru
| Nauru |
|---|
|
| Jan | Feb | Mar | Apr | May | Jun | Jul | Aug | Sep | Oct | Nov | Dec |
|---|
| Min temp. | 26 | 26 | 26 | 26 | 26 | 26 | 26 | 26 | 26 | 26 | 26 | 26 |
|---|
| Max temp. | 31 | 31 | 31 | 31 | 31 | 31 | 31 | 31 | 32 | 32 | 31 | 32 |
|---|
| Precip. | 280 | 250 | 190 | 190 | 120 | 110 | 150 | 130 | 120 | 100 | 120 | 260 |
|---|
| Prec. days | 16 | 14 | 13 | 11 | 9 | 9 | 12 | 14 | 11 | 10 | 13 | 15 |
|---|
|
| Day length | 12 | 12 | 12 | 12 | 12 | 12 | 12 | 12 | 12 | 12 | 12 | 12 |
|---|
|
| Sea temp | 29 | 29 | 29 | 29 | 29 | 29 | 29 | 29 | 29 | 29 | 29 | 29 |
|---|