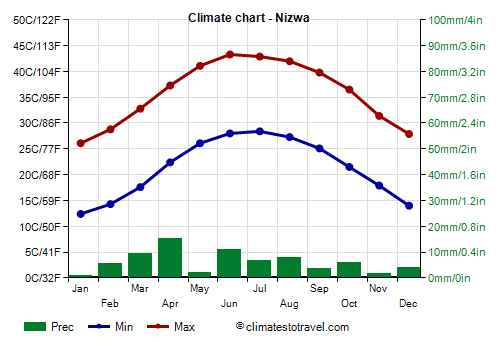
Select units of measurement for the temperature and rainfall tables (metric or imperial).
Average weather, temperature, rainfall, sunshine hours

The climate of Nizwa is
tropical desert, with warm winters and long, very hot summers.
Nizwa is a city of 72,000 inhabitants, located in Oman, in the governorate of al-Dākhiliyya, at 500 meters (1,650 feet) above sea level, on the southern slope of the Hajar mountains (in the part called Jebel Akhdar), and at 23 degrees north latitude.
About 40 km (25 mi) northwest is Oman's highest peak, Jebel Shams, which is 3,019 meters (9,872 feet) high.
Precipitation is very scarce, since it amounts to about 75 millimeters (3 inches) per year. Although it is rare in all months, it occurs preferably in two periods: from December to April, when depressions form on the Persian Gulf and the Gulf of Oman, and from June to August, when rains can occur brought by the monsoon circulation that affects the eastern part of the Arabian Peninsula in summer.
The
winter, from December to February, is warm. The average temperature in January is around 19 °C (66 °F). The sun often shines even in this season, and rainfall is rare.
There can sometimes be cool periods, with lows below 10 °C (50 °F), and highs around 20 °C (68 °F). In February 2008 and February 2017, the temperature dropped to 4.5 °C (40 °F).
The long
summer, from April to October, is very hot. The daily average in June and July is 35.5 °C (96 °F). There are periods with clear skies and dry air, typical of the desert, however, as mentioned, there are periods in which a bit of cloudiness can form, humidity increases and, although rarely, some rain can fall.
On the
hottest days the temperature can exceed 45 °C (113 °F) from May to September. In July 2013 it reached 49.4 °C (102.9 °F).
Nizwa - Climate data
In Nizwa, the
average temperature of the coldest month (January) is of
19.2 °C, that of the warmest months (June, July) is of
35.6 °C. Here are the average temperatures.
Nizwa - Average temperatures (1991-2020) |
| Month | Min | Max | Mean |
|---|
| January | 12.4 | 26.1 | 19.2 |
|---|
| February | 14.3 | 28.8 | 21.6 |
|---|
| March | 17.6 | 32.8 | 25.2 |
|---|
| April | 22.4 | 37.3 | 29.8 |
|---|
| May | 26.1 | 41.1 | 33.6 |
|---|
| June | 28 | 43.3 | 35.6 |
|---|
| July | 28.4 | 42.9 | 35.6 |
|---|
| August | 27.3 | 42 | 34.6 |
|---|
| September | 25.1 | 39.8 | 32.4 |
|---|
| October | 21.5 | 36.5 | 29 |
|---|
| November | 17.9 | 31.4 | 24.6 |
|---|
| December | 14 | 27.9 | 21 |
|---|
| Year | 21.3 | 35.9 | 28.5 |
|---|
amounts to
75 millimeters per year: it is therefore at a desert level. It ranges from
0.7 millimeters in the driest month (January) to
15.2 millimeters in the wettest one (April). Here is the average precipitation.
Nizwa - Average precipitation| Month | Days |
|---|
| January | 1 | 1 |
|---|
| February | 6 | 0 |
|---|
| March | 9 | 1 |
|---|
| April | 15 | 1 |
|---|
| May | 2 | 1 |
|---|
| June | 11 | 1 |
|---|
| July | 7 | 1 |
|---|
| August | 8 | 2 |
|---|
| September | 4 | 1 |
|---|
| October | 6 | 1 |
|---|
| November | 2 | 0 |
|---|
| December | 4 | 0 |
|---|
| Year | 75 | 12 |
|---|