Select units of measurement for the temperature and rainfall tables (metric or imperial).
Average weather, temperature, rainfall, sunshine
The climate of the Northern Mariana Islands, a Commonwealth (U.S. territory) located between the Philippine Sea and Pacific Ocean, is
tropical, hot and humid all year round, with a cooler, drier season from December to June and a hotter, rainy season from July to November.
Temperatures are stable throughout the year, especially on the southern islands, which are closer to the Equator and are also the inhabited ones (Saipan, Tinian and Rota): here, the daytime temperature ranges from 28/29 °C (82/84 °F) in the coolest period to 30/31 °C (86/88 °F) in the warmest. The heat is sultry, but tempered by the trade winds.
Furthermore, the temperatures vary slightly from the average. At night, it never gets cold, and the temperature never drops below 20 °C (68 °F). On cooler nights, the temperature typically drops to 22 °C (71.5 °F) from January to March. On warmer days, it typically reaches 33 °C (91.5 °F) from June to August.
Rainfall is abundant, in fact, ranges from 1,800 to 2,400 millimeters (70 to 94 inches) per year.
The temperature of the
sea is warm enough for swimming all year round: it drops to 27 °C (81 °F) in February and March.
The climate in detail
Temperature and rain
Saipan

At
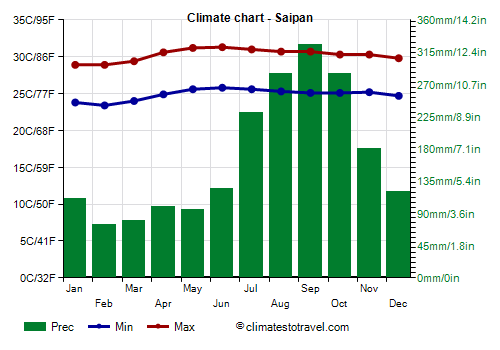
Saipan International Airport, at 15 degrees north latitude, the average temperature varies between 26.2 °C (79 °F) in February and 28.6 °C (83.5 °F) in June.
On average, 1,770 mm (70 in) of rain fall per year. The rainiest period is from August to October, when more than 270 mm (10.6 in) of rain fall per month.
On this island there is the village of
Susupe, the capital, which however, being at 250 meters (820 ft) above sea level, is slightly cooler, in fact the maximum temperatures do not reach 30 °C (86 °F) on average in any month, and also rainier, in fact it receives 2,225 mm (88 in) of rain per year, of which more than 200 mm (8 in) from July to November.
In Saipan, the wettest months are August, September and October, with more than 250 mm (10 in) of rain per month, while in the least rainy months, from February to May, from 70 to 100 mm (1.6 to 4 in) of rain fall per month.
In the Northern Mariana Islands, there is a moderate amount of
sunshine, since a bit of cloudiness can always form, which can develop and lead to thunderstorms, but the sun comes out between one shower and another. The sunniest period is the least rainy one. In Sapaian, there are an average of 2,250 hours of sunshine per year.

The
other islands, located north of the three permanently inhabited ones, are gradually cooler in winter and generally less rainy throughout the year. However, along the slopes exposed to the north-east trade winds (they are volcanic islands, with some elevations in the interior), the rains may be locally more abundant. The northernmost island, Farallon de Pajaros (or Urracas), is located at 20 degrees north latitude.
Tropical cyclones
The Northern Mariana Islands are located in the path of
typhoons, the tropical cyclones of south-east Asia, towards which they normally move after passing over the islands. The period when they typically occur is from May to December, though they are more frequent between August and November. However, they have sometimes affected this area at other periods, in April (Typhoon Isa in 1997, and Kong-rey in 2007) and January (Roy in 1988).
When to go
The best time to visit the Northern Marianas runs from
January to April, since it's the least hot and the least rainy, and (normally) outside of the typhoon season. February and March are the best months of all.
What to pack
All year round, bring light clothes of natural fibers, a sun hat, a scarf for the breeze, a light sweatshirt for the evening, and a light raincoat or umbrella.
When going to the reef, you can bring snorkeling equipment, including water shoes or rubber-soled shoes.
Climate data - Northern Mariana Islands
| Rota (180 meters) |
|---|
|
| Jan | Feb | Mar | Apr | May | Jun | Jul | Aug | Sep | Oct | Nov | Dec |
|---|
| Min temp. | 23 | 23 | 24 | 24 | 24 | 25 | 24 | 24 | 24 | 24 | 24 | 24 |
|---|
| Max temp. | 29 | 29 | 29 | 30 | 30 | 31 | 30 | 30 | 30 | 30 | 30 | 29 |
|---|
| Precip. | 145 | 120 | 90 | 95 | 95 | 135 | 250 | 360 | 380 | 350 | 190 | 135 |
|---|
| Prec. days | 16 | 13 | 12 | 13 | 13 | 16 | 21 | 21 | 21 | 22 | 19 | 16 |
|---|
| Humidity | 80% | 79% | 78% | 78% | 78% | 79% | 82% | 83% | 83% | 83% | 82% | 82% |
|---|
| Day length | 11 | 12 | 12 | 12 | 13 | 13 | 13 | 13 | 12 | 12 | 12 | 11 |
|---|
|
|
| Saipan |
|---|
|
| Jan | Feb | Mar | Apr | May | Jun | Jul | Aug | Sep | Oct | Nov | Dec |
|---|
| Min temp. | 24 | 23 | 24 | 25 | 26 | 26 | 26 | 25 | 25 | 25 | 25 | 25 |
|---|
| Max temp. | 29 | 29 | 29 | 31 | 31 | 31 | 31 | 31 | 31 | 30 | 30 | 30 |
|---|
| Precip. | 95 | 65 | 50 | 70 | 80 | 110 | 190 | 325 | 290 | 270 | 130 | 95 |
|---|
| Prec. days | 12 | 10 | 9 | 10 | 12 | 15 | 20 | 20 | 20 | 21 | 16 | 14 |
|---|
| Humidity | 78% | 78% | 77% | 77% | 78% | 78% | 82% | 83% | 84% | 84% | 82% | 80% |
|---|
| Day length | 11 | 12 | 12 | 12 | 13 | 13 | 13 | 13 | 12 | 12 | 11 | 11 |
|---|
| Sun hours | 6 | 6 | 7 | 8 | 8 | 7 | 6 | 6 | 6 | 5 | 5 | 5 |
|---|
| Sea temp | 28 | 27 | 27 | 28 | 29 | 29 | 30 | 30 | 30 | 29 | 29 | 28 |
|---|