Select units of measurement for the temperature and rainfall tables (metric or imperial).
Average weather, temperature, rainfall, sunshine
On the Marshall Islands, the climate is
equatorial in the central and southern islands, that is to say, hot all year round, with abundant rains and no dry season. In the northern islands, on the other hand, the climate is
tropical, since there is a relatively dry season from December to April.
The Marshall Islands are located in the Pacific Ocean, between the Equator and the Tropic of Cancer.
The trade winds blow constantly, tempering the heat.
The
sea on the Marshall Islands is pleasantly warm all year round.
The islands are divided into
two groups, Ralik and Ratak, parallel to each other and arranged from north to south.
The climate in detail
North
On the
northernmost islands of both groups, which lie north of the tenth parallel (Enewetak, Bikini, Rongelap, Taka, Utirik, Taongi), as mentioned, there is a
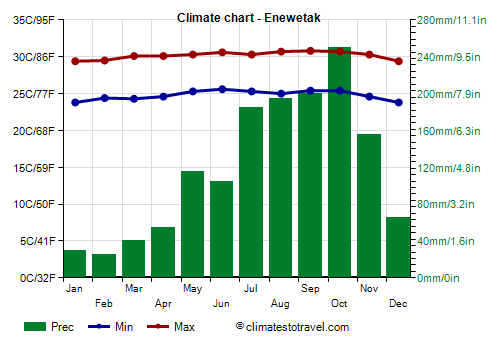
relatively dry season from December to April. Annual rainfall is around 1,500 millimeters (60 inches), with a maximum between July and October, when it exceeds 200/250 mm (8/10 in) per month, and a minimum from January to March, when it drops below 40 mm (1.6 in) per month.
During
El Niño years, when the rains decrease throughout the islands, these northern atolls, which are already less rainy in normal years, can experience drought.
Enewetak

On the northern atoll of
Enewetak, located at 11 degrees north latitude, even though the temperatures are stable, there is a slightly warmer period from June to October, while December and January are the coolest months.
As mentioned, the northern islands are the least rainy, and there is a relatively dry season from December to April. Enewetak receives 1,400 mm (55 in) of rain annually.
Center-South
As mentioned, the
central and southern islands, closer to the equator, are rainy all year round, so their climate can be called
equatorial.
Moving south, rainfall becomes progressively more abundant, so much so that it can reach 2,500 mm (100 in) per year already in Kwajalein atoll. At this latitude, the rains are still acceptable between January and March, since rainfall drops below 110 mm (4.3 in) per month.
Majuro

In the capital,
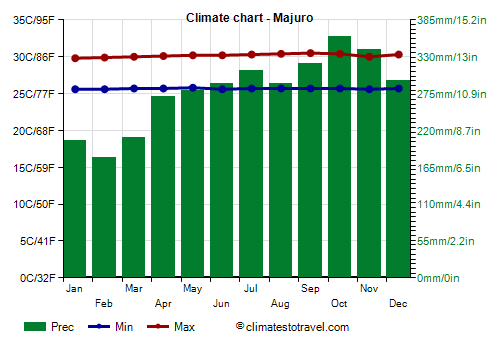
Majuro, located at 7 degrees north latitude, the temperature is definitely stable throughout the year: lows are around 25.5 °C (78 °F), while highs are around 30/30.5 °C (86/87 °F). The temperature rarely drops below 22 °C (72 °F) at night or exceeds 32/33 °C (90/91 °F) during the day. The wind is more constant from December to April, while it is weaker from August to October.
In the southernmost atolls, the rains are really abundant: in Majuro, 3,335 mm (131 in) of rain fall per year, with a minimum of 195 mm (7.7 in) in February and a maximum of 350 mm (13.8 in) in October.
During El Niño years, rainfall decreases significantly from January to April, and sometimes in May. During this period, only 115 mm (4.5 in) of rain fell in 1983, 70 mm (2.8 in) in 1998 and 195 mm (7.7 in) in 2016.
Since the rains occur in the form of short and intense downpour or thunderstorm, and therefore do not last long, the amount of
sunshine on the Marshall Islands is at least acceptable even in the wettest months. In Majuro, there is an average of 2,600 hours of sunshine per year.

Tropical cyclones
The Marshall Islands can be affected by
tropical cyclones; in particular, many of the typhoons that later head towards South-east Asia are formed in this area. For this reason, cyclones do not generally affect these islands at the peak of their strength, since they are still in the early stages.
Typically, typhoons occur from April to December, although they are more frequent between August and November. However, since the sea is always warm, they can sometimes also occur from January to March, although during this period, only not intense tropical depressions are usually formed.
When to go
The best time to visit the Marshall Islands runs
from January to March in the central and southern atolls, since it is the least rainy period, even though there is still a fair amount of showers and thunderstorms. On the northern islands, instead, the best period runs from
December to April, when the rains are quite rare and generally not abundant.
What to pack
All year round, bring
tropics-friendly, loose-fitting clothing, a sun hat, a scarf for the breeze, a light sweatshirt for the evening, and a light raincoat or umbrella.
When going to the reef, you can bring snorkeling equipment, including water shoes or rubber-soled shoes.
Climate data - Marshall Islands
| Enewetak |
|---|
|
| Jan | Feb | Mar | Apr | May | Jun | Jul | Aug | Sep | Oct | Nov | Dec |
|---|
| Min temp. | 24 | 24 | 24 | 25 | 25 | 26 | 25 | 25 | 25 | 25 | 25 | 24 |
|---|
| Max temp. | 29 | 30 | 30 | 30 | 30 | 31 | 30 | 31 | 31 | 31 | 30 | 29 |
|---|
| Precip. | 30 | 25 | 40 | 55 | 115 | 105 | 185 | 195 | 200 | 250 | 155 | 65 |
|---|
| Prec. days | 13 | 10 | 12 | 13 | 17 | 18 | 22 | 21 | 21 | 22 | 20 | 16 |
|---|
|
| Day length | 12 | 12 | 12 | 12 | 13 | 13 | 13 | 12 | 12 | 12 | 12 | 12 |
|---|
|
| Sea temp | 28 | 27 | 28 | 28 | 28 | 29 | 29 | 29 | 29 | 29 | 29 | 28 |
|---|
| Kwajalein |
|---|
|
| Jan | Feb | Mar | Apr | May | Jun | Jul | Aug | Sep | Oct | Nov | Dec |
|---|
| Min temp. | 26 | 26 | 26 | 26 | 26 | 26 | 26 | 26 | 26 | 26 | 26 | 26 |
|---|
| Max temp. | 30 | 30 | 30 | 30 | 30 | 30 | 30 | 31 | 31 | 31 | 30 | 30 |
|---|
| Precip. | 115 | 100 | 115 | 175 | 195 | 195 | 245 | 270 | 265 | 310 | 275 | 190 |
|---|
| Prec. days | 11 | 10 | 11 | 12 | 15 | 17 | 20 | 20 | 18 | 21 | 19 | 15 |
|---|
| Humidity | 76% | 75% | 75% | 76% | 78% | 79% | 79% | 79% | 79% | 79% | 79% | 77% |
|---|
| Day length | 12 | 12 | 12 | 12 | 12 | 13 | 13 | 12 | 12 | 12 | 12 | 12 |
|---|
|
|
| Majuro |
|---|
|
| Jan | Feb | Mar | Apr | May | Jun | Jul | Aug | Sep | Oct | Nov | Dec |
|---|
| Min temp. | 26 | 26 | 26 | 26 | 26 | 26 | 26 | 26 | 26 | 26 | 26 | 26 |
|---|
| Max temp. | 30 | 30 | 30 | 30 | 30 | 30 | 30 | 30 | 30 | 30 | 30 | 30 |
|---|
| Precip. | 210 | 195 | 220 | 280 | 270 | 280 | 280 | 285 | 320 | 350 | 340 | 300 |
|---|
| Prec. days | 16 | 13 | 14 | 16 | 18 | 19 | 21 | 19 | 19 | 21 | 20 | 19 |
|---|
| Humidity | 79% | 78% | 78% | 79% | 80% | 80% | 80% | 79% | 79% | 79% | 80% | 80% |
|---|
| Day length | 12 | 12 | 12 | 12 | 12 | 12 | 12 | 12 | 12 | 12 | 12 | 12 |
|---|
| Sun hours | 7 | 8 | 8 | 7 | 7 | 7 | 7 | 7 | 7 | 7 | 6 | 6 |
|---|
| Sea temp | 28 | 28 | 28 | 28 | 29 | 29 | 29 | 29 | 30 | 29 | 29 | 29 |
|---|