Select units of measurement for the temperature and rainfall tables (metric or imperial).
Average weather, temperature, rainfall, sunshine
In Ivory Coast, the climate is
tropical, with a dry season from December to February and a rainy season from April to October due to the
African monsoon. Along the coast, the rains are significant also in March and November, and even in December on the westernmost part.
Rainfall is more abundant on the coast, where it's between 1,500 and 2,500 millimeters (60 and 100 inches) per year, while in inland areas, it's generally less intense and ranges from 1,200 to 1,500 mm (47 to 60 in) per year, even though it reaches 2,000 mm (80 in) in the small western mountainous area.
The
sea in the Ivory Coast is warm enough for swimming all year round, although the water temperature decreases a bit from July to October.
The climate in detail
The seasons
During
winter, the weather is good and the temperatures are high throughout the country, even in December and January, when the maximum temperatures are around 31/32 °C (88/90 °F) on the coast, and 33/34 °C (91/93 °F) in inland areas. In the interior, the humidity is low, since the prevailing wind, the
Harmattan, blows from the desert, and it's able to raise dust, which can veil the sky and create a characteristic mist.
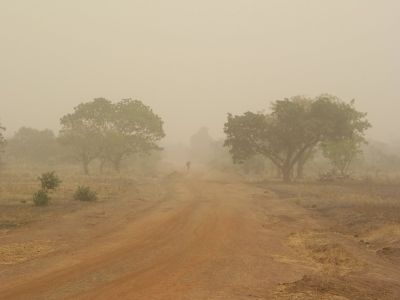
Along the coast, the humidity is higher, and a few showers may still occur in winter, especially in the western part, and particularly in December, when the sea is a bit warmer and evaporation is higher. Sometimes, nights can be cool in the interior, where lows can drop to around 10 °C (50 °F). At other times, it can get very hot during the day, with peaks around 38/40 °C (100/104 °F), while on the coast the temperatures reach 34/35 °C (93/95 °F), when the wind from the desert manages to arrive there.
By
February, the temperature begins to rise in inland areas, and it can reach 40 °C (104 °F). On the coast, the temperature is more stable, even though air humidity increases, making it feel more uncomfortable.
In April, showers become more frequent along the coast, while in the north, it is still very hot. Between April and May, the rains begin across the country, but they become really heavy only along the coast, where more than 200 mm (8 in) fall per month in May and June, and even 400 mm (16 in) in some areas. Cloudiness too, is more frequent and compact in the south and along the coast, while in the north, there can also be periods of good weather.
While in the north the rains reach their peak between July and September, in the center-south and along the coast, there is a
decrease in rainfall, especially in August in the central and eastern part of the coast. After this period, from September to November, the rains resume without reaching again the peaks of May and June. However, along the coast, the sky remains cloudy even in this period.
The period from June to September is also the one with the lowest daytime temperatures, which drop to around 30 °C (86 °F) in inland areas and to 28 °C (82 °F) on the coast; on the other hand, the humidity is high everywhere, bringing a sticky feeling to the air, although sea breezes give some relief along the coast.
In late October and November, with the end of the rainy season, the temperatures begin to rise again in the center and north, while the rains continue to fall on the coast.
The center-north
Korhogo
In the northern city of
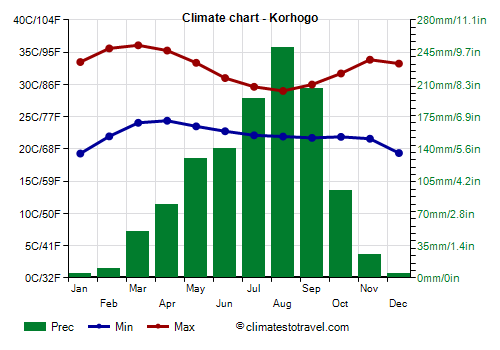
Korhogo, the hottest months are March and April, with a daily average of 30 °C (86 °F).
Precipitation amounts to 1,200 mm (47 in) per year.
In the north, in winter, and in general in the dry season, the sun shines very often, while in the summer rainy season, the hours of sunshine decrease a little.
Yamoussoukro
In the capital,
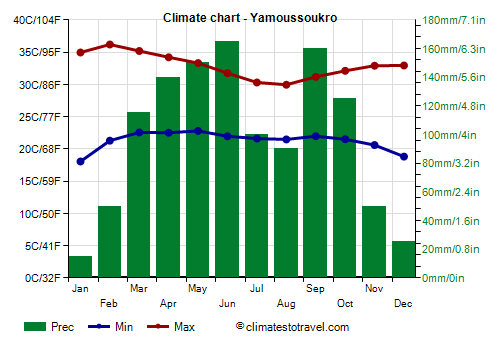
Yamoussoukro, located in the center-south of the country, the climate is similar to that of Korhogo; however, being more to the south, the rains begin a little earlier, and already in March, 115 mm (4.5 in) of rain fall, while there is a certain decrease in rainfall in July and August, with about 90 mm (3.5 in) per month. Rainfall amounts to almost 1,200 mm (47 in) per year.
The coast
Along the coast, the temperatures are more stable over the seasons compared with the interior. As regards to the rainfall, as mentioned, it is more abundant than in the rest of the country. Furthermore, there is a difference between the areas, given that the western part of the coast is rainier than the eastern one.
Abidjan
In the former capital,
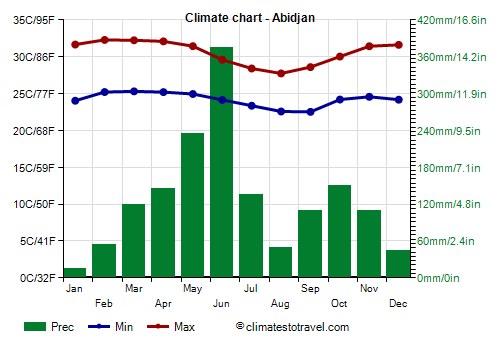
Abidjan, located in the eastern part of the coast, 1,500 mm (60 in) of rain fall per year, with a maximum in May and in June, while there's a fairly sharp decline between July and August, and a recovery between September and November.
In Abidjan, the warmest months are February and March, while the coolest is August.
In Abidjan, the sun shines quite often in winter and spring, while the sky becomes often cloudy in summer.
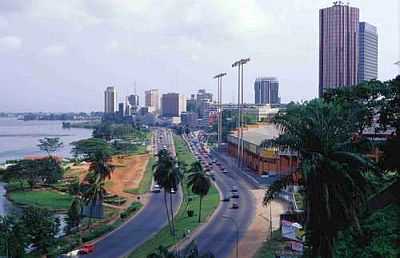
In the western part of the coast, the rains are more abundant, and the decrease during the summer is not so noticeable.
Tabou
In
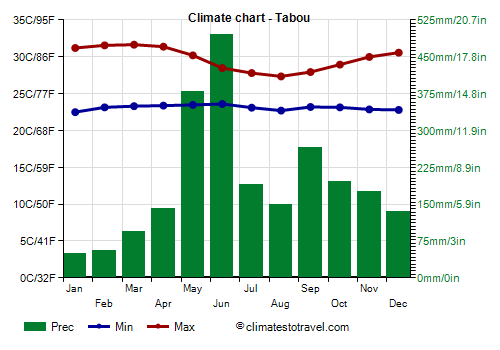
Tabou, where 2,300 mm (90 in) of rain fall per year, after a peak of 380 mm (15 in) in May and 500 mm (20 in) in June, the rainfall decreases to 190 mm (7.5 in) in July and 150 mm (6 in) in August, before rebounding to 265 mm (10.4 in) in September.
In the western part of the coast, the amount of sunshine is not great, and it is lower than in Abidjan.
When to go
The best time to visit the Ivory Coast is winter, from
December to February. On the coast, especially in the western part, December is still quite rainy, while in inland areas, it begins to get very hot by February, so all in all, the best month for the whole country is January.
In the area of Abidjan, however, the rains are not abundant in August, even though the sky is often cloudy.
What to pack
In
winter: in Abidjan and on the coast, bring light clothes for the day, a light sweatshirt for the evening, a scarf for the wind-borne dust. In the north, bring light clothing, a sweatshirt and a light jacket for the evening, and a scarf for the desert wind.
In
summer: bring loose-fitting clothing, light shirts and pants of natural fibers (cotton, linen) or synthetics that breathe, and a light sweatshirt and a light raincoat (or an umbrella) for the rain showers.
Climate data - Ivory Coast
| Abidjan |
|---|
|
| Jan | Feb | Mar | Apr | May | Jun | Jul | Aug | Sep | Oct | Nov | Dec |
|---|
| Min temp. | 24 | 25 | 25 | 25 | 25 | 24 | 23 | 23 | 23 | 24 | 25 | 24 |
|---|
| Max temp. | 32 | 32 | 32 | 32 | 31 | 30 | 28 | 28 | 29 | 30 | 31 | 32 |
|---|
| Precip. | 15 | 55 | 120 | 145 | 235 | 375 | 135 | 50 | 110 | 150 | 110 | 45 |
|---|
| Prec. days | 3 | 5 | 9 | 11 | 17 | 21 | 13 | 12 | 12 | 14 | 13 | 7 |
|---|
| Humidity | 83% | 85% | 85% | 84% | 86% | 88% | 89% | 90% | 90% | 88% | 85% | 85% |
|---|
| Day length | 12 | 12 | 12 | 12 | 12 | 12 | 12 | 12 | 12 | 12 | 12 | 12 |
|---|
| Sun hours | 6 | 8 | 7 | 7 | 6 | 4 | 4 | 4 | 5 | 7 | 8 | 7 |
|---|
| Sea temp | 28 | 28 | 28 | 29 | 29 | 28 | 26 | 25 | 25 | 27 | 28 | 28 |
|---|
| Adiaké |
|---|
|
| Jan | Feb | Mar | Apr | May | Jun | Jul | Aug | Sep | Oct | Nov | Dec |
|---|
| Min temp. | 23 | 24 | 24 | 24 | 24 | 24 | 23 | 22 | 23 | 23 | 23 | 23 |
|---|
| Max temp. | 32 | 33 | 33 | 33 | 32 | 30 | 29 | 28 | 29 | 30 | 32 | 32 |
|---|
| Precip. | 30 | 65 | 115 | 150 | 280 | 480 | 185 | 70 | 125 | 195 | 135 | 65 |
|---|
| Prec. days | 2 | 3 | 5 | 5 | 12 | 18 | 15 | 13 | 14 | 13 | 7 | 3 |
|---|
| Humidity | 80% | 82% | 82% | 82% | 85% | 88% | 87% | 87% | 88% | 86% | 84% | 82% |
|---|
| Day length | 12 | 12 | 12 | 12 | 12 | 12 | 12 | 12 | 12 | 12 | 12 | 12 |
|---|
| Sun hours | 6 | 6 | 6 | 7 | 6 | 4 | 3 | 3 | 3 | 5 | 7 | 6 |
|---|
| Sea temp | 28 | 28 | 28 | 29 | 29 | 28 | 26 | 25 | 25 | 27 | 28 | 28 |
|---|
| Bondoukou (350 meters) |
|---|
|
| Jan | Feb | Mar | Apr | May | Jun | Jul | Aug | Sep | Oct | Nov | Dec |
|---|
| Min temp. | 21 | 23 | 24 | 23 | 23 | 22 | 22 | 22 | 22 | 22 | 22 | 21 |
|---|
| Max temp. | 35 | 36 | 35 | 34 | 32 | 30 | 29 | 28 | 29 | 31 | 33 | 33 |
|---|
| Precip. | 10 | 25 | 90 | 125 | 155 | 160 | 95 | 90 | 175 | 130 | 30 | 10 |
|---|
| Prec. days | 1 | 2 | 4 | 6 | 7 | 8 | 9 | 10 | 11 | 6 | 2 | 1 |
|---|
| Humidity | 40% | 46% | 61% | 70% | 75% | 80% | 82% | 83% | 83% | 79% | 73% | 58% |
|---|
| Day length | 12 | 12 | 12 | 12 | 12 | 13 | 12 | 12 | 12 | 12 | 12 | 12 |
|---|
| Sun hours | 7 | 8 | 7 | 7 | 7 | 5 | 4 | 3 | 4 | 6 | 7 | 7 |
|---|
|
| Bouaké (350 meters) |
|---|
|
| Jan | Feb | Mar | Apr | May | Jun | Jul | Aug | Sep | Oct | Nov | Dec |
|---|
| Min temp. | 21 | 23 | 23 | 23 | 22 | 22 | 21 | 21 | 21 | 21 | 22 | 21 |
|---|
| Max temp. | 34 | 35 | 34 | 33 | 32 | 30 | 28 | 28 | 29 | 30 | 32 | 32 |
|---|
| Precip. | 10 | 40 | 85 | 125 | 125 | 145 | 120 | 130 | 170 | 110 | 30 | 15 |
|---|
| Prec. days | 1 | 2 | 5 | 7 | 8 | 8 | 11 | 12 | 11 | 6 | 2 | 1 |
|---|
| Humidity | 43% | 48% | 63% | 74% | 79% | 83% | 85% | 86% | 86% | 83% | 75% | 57% |
|---|
| Day length | 12 | 12 | 12 | 12 | 12 | 13 | 12 | 12 | 12 | 12 | 12 | 12 |
|---|
|
|
| Daloa (250 meters) |
|---|
|
| Jan | Feb | Mar | Apr | May | Jun | Jul | Aug | Sep | Oct | Nov | Dec |
|---|
| Min temp. | 22 | 23 | 23 | 23 | 23 | 23 | 22 | 22 | 22 | 22 | 23 | 21 |
|---|
| Max temp. | 34 | 35 | 34 | 34 | 33 | 31 | 30 | 29 | 31 | 32 | 33 | 33 |
|---|
| Precip. | 0 | 70 | 140 | 95 | 90 | 130 | 160 | 220 | 230 | 135 | 50 | 15 |
|---|
| Prec. days | 0 | 3 | 5 | 7 | 7 | 10 | 11 | 15 | 15 | 10 | 4 | 1 |
|---|
| Humidity | 59% | 64% | 73% | 77% | 80% | 83% | 86% | 86% | 85% | 83% | 79% | 67% |
|---|
| Day length | 12 | 12 | 12 | 12 | 12 | 12 | 12 | 12 | 12 | 12 | 12 | 12 |
|---|
|
|
| Dimbokro |
|---|
|
| Jan | Feb | Mar | Apr | May | Jun | Jul | Aug | Sep | Oct | Nov | Dec |
|---|
| Min temp. | 21 | 24 | 24 | 24 | 24 | 23 | 23 | 22 | 23 | 23 | 23 | 22 |
|---|
| Max temp. | 35 | 37 | 36 | 35 | 34 | 32 | 31 | 31 | 32 | 33 | 34 | 34 |
|---|
| Precip. | 10 | 50 | 120 | 140 | 160 | 205 | 110 | 75 | 125 | 120 | 60 | 25 |
|---|
| Prec. days | 1 | 2 | 5 | 6 | 9 | 11 | 11 | 9 | 11 | 8 | 3 | 1 |
|---|
| Humidity | 66% | 68% | 73% | 77% | 80% | 83% | 84% | 82% | 82% | 81% | 79% | 74% |
|---|
| Day length | 12 | 12 | 12 | 12 | 12 | 12 | 12 | 12 | 12 | 12 | 12 | 12 |
|---|
| Sun hours | 7 | 6 | 7 | 7 | 7 | 5 | 4 | 3 | 4 | 6 | 7 | 6 |
|---|
|
| Gagnoa |
|---|
|
| Jan | Feb | Mar | Apr | May | Jun | Jul | Aug | Sep | Oct | Nov | Dec |
|---|
| Min temp. | 21 | 23 | 23 | 23 | 23 | 22 | 22 | 22 | 22 | 22 | 23 | 22 |
|---|
| Max temp. | 34 | 35 | 34 | 34 | 33 | 31 | 30 | 30 | 31 | 32 | 32 | 32 |
|---|
| Precip. | 25 | 65 | 125 | 165 | 180 | 205 | 90 | 95 | 170 | 160 | 95 | 40 |
|---|
| Prec. days | 1 | 3 | 5 | 6 | 9 | 12 | 10 | 12 | 12 | 8 | 4 | 2 |
|---|
| Humidity | 70% | 71% | 76% | 79% | 82% | 85% | 85% | 84% | 84% | 83% | 82% | 79% |
|---|
| Day length | 12 | 12 | 12 | 12 | 12 | 12 | 12 | 12 | 12 | 12 | 12 | 12 |
|---|
| Sun hours | 6 | 7 | 6 | 7 | 7 | 4 | 4 | 3 | 4 | 6 | 6 | 5 |
|---|
|
| Korhogo (350 meters) |
|---|
|
| Jan | Feb | Mar | Apr | May | Jun | Jul | Aug | Sep | Oct | Nov | Dec |
|---|
| Min temp. | 19 | 22 | 24 | 24 | 24 | 23 | 22 | 22 | 22 | 22 | 22 | 19 |
|---|
| Max temp. | 33 | 36 | 36 | 35 | 33 | 31 | 30 | 29 | 30 | 32 | 34 | 33 |
|---|
| Precip. | 5 | 10 | 50 | 80 | 130 | 140 | 195 | 250 | 205 | 95 | 25 | 5 |
|---|
| Prec. days | 1 | 2 | 5 | 9 | 11 | 12 | 15 | 17 | 17 | 11 | 3 | 1 |
|---|
| Humidity | 23% | 30% | 47% | 59% | 70% | 77% | 80% | 83% | 83% | 75% | 57% | 35% |
|---|
| Day length | 12 | 12 | 12 | 12 | 13 | 13 | 13 | 12 | 12 | 12 | 12 | 12 |
|---|
| Sun hours | 9 | 9 | 8 | 8 | 8 | 7 | 6 | 5 | 6 | 8 | 9 | 8 |
|---|
|
| Man (350 meters) |
|---|
|
| Jan | Feb | Mar | Apr | May | Jun | Jul | Aug | Sep | Oct | Nov | Dec |
|---|
| Min temp. | 16 | 19 | 22 | 22 | 23 | 22 | 22 | 21 | 22 | 21 | 21 | 18 |
|---|
| Max temp. | 34 | 35 | 35 | 33 | 32 | 30 | 29 | 28 | 30 | 31 | 31 | 32 |
|---|
| Precip. | 10 | 45 | 110 | 155 | 150 | 185 | 185 | 275 | 285 | 135 | 40 | 20 |
|---|
| Prec. days | 1 | 2 | 5 | 6 | 8 | 12 | 19 | 21 | 17 | 10 | 3 | 1 |
|---|
| Humidity | 58% | 58% | 71% | 78% | 81% | 85% | 88% | 89% | 86% | 85% | 82% | 72% |
|---|
| Day length | 12 | 12 | 12 | 12 | 12 | 12 | 12 | 12 | 12 | 12 | 12 | 12 |
|---|
| Sun hours | 8 | 8 | 7 | 7 | 7 | 5 | 4 | 4 | 5 | 7 | 7 | 7 |
|---|
|
| Odienné (400 meters) |
|---|
|
| Jan | Feb | Mar | Apr | May | Jun | Jul | Aug | Sep | Oct | Nov | Dec |
|---|
| Min temp. | 16 | 19 | 23 | 23 | 23 | 22 | 22 | 21 | 21 | 21 | 19 | 16 |
|---|
| Max temp. | 34 | 36 | 37 | 35 | 33 | 32 | 30 | 30 | 30 | 32 | 33 | 33 |
|---|
| Precip. | 5 | 10 | 35 | 80 | 120 | 155 | 285 | 340 | 250 | 140 | 30 | 15 |
|---|
| Prec. days | 0 | 1 | 3 | 5 | 6 | 7 | 11 | 14 | 11 | 5 | 2 | 1 |
|---|
| Humidity | 36% | 34% | 46% | 62% | 73% | 78% | 82% | 84% | 82% | 78% | 68% | 48% |
|---|
| Day length | 12 | 12 | 12 | 12 | 13 | 13 | 13 | 12 | 12 | 12 | 12 | 12 |
|---|
| Sun hours | 8 | 8 | 7 | 7 | 8 | 7 | 6 | 6 | 6 | 8 | 8 | 8 |
|---|
|
| Sassandra |
|---|
|
| Jan | Feb | Mar | Apr | May | Jun | Jul | Aug | Sep | Oct | Nov | Dec |
|---|
| Min temp. | 24 | 24 | 24 | 24 | 24 | 24 | 23 | 22 | 23 | 24 | 24 | 24 |
|---|
| Max temp. | 32 | 32 | 32 | 32 | 31 | 29 | 28 | 28 | 28 | 30 | 31 | 31 |
|---|
| Precip. | 15 | 35 | 55 | 95 | 235 | 530 | 190 | 30 | 45 | 85 | 120 | 75 |
|---|
| Prec. days | 1 | 2 | 3 | 5 | 12 | 16 | 10 | 11 | 8 | 8 | 6 | 3 |
|---|
| Humidity | 82% | 84% | 84% | 84% | 86% | 88% | 87% | 88% | 89% | 87% | 85% | 84% |
|---|
| Day length | 12 | 12 | 12 | 12 | 12 | 12 | 12 | 12 | 12 | 12 | 12 | 12 |
|---|
| Sun hours | 7 | 7 | 7 | 7 | 6 | 4 | 4 | 4 | 5 | 7 | 7 | 7 |
|---|
| Sea temp | 28 | 28 | 28 | 29 | 29 | 28 | 26 | 25 | 25 | 27 | 28 | 28 |
|---|
| Tabou |
|---|
|
| Jan | Feb | Mar | Apr | May | Jun | Jul | Aug | Sep | Oct | Nov | Dec |
|---|
| Min temp. | 22 | 23 | 23 | 23 | 23 | 24 | 23 | 23 | 23 | 23 | 23 | 23 |
|---|
| Max temp. | 31 | 32 | 32 | 31 | 30 | 28 | 28 | 27 | 28 | 29 | 30 | 31 |
|---|
| Precip. | 50 | 55 | 95 | 140 | 380 | 495 | 190 | 150 | 265 | 195 | 175 | 135 |
|---|
| Prec. days | 5 | 5 | 7 | 11 | 21 | 22 | 16 | 19 | 21 | 18 | 16 | 10 |
|---|
| Humidity | 83% | 85% | 84% | 85% | 87% | 86% | 85% | 87% | 89% | 88% | 87% | 86% |
|---|
| Day length | 12 | 12 | 12 | 12 | 12 | 12 | 12 | 12 | 12 | 12 | 12 | 12 |
|---|
| Sun hours | 6 | 6 | 6 | 7 | 5 | 3 | 3 | 3 | 4 | 6 | 6 | 6 |
|---|
| Sea temp | 28 | 28 | 28 | 29 | 29 | 28 | 26 | 25 | 25 | 27 | 28 | 28 |
|---|
| Yamoussoukro |
|---|
|
| Jan | Feb | Mar | Apr | May | Jun | Jul | Aug | Sep | Oct | Nov | Dec |
|---|
| Min temp. | 18 | 21 | 23 | 23 | 23 | 22 | 22 | 21 | 22 | 22 | 21 | 19 |
|---|
| Max temp. | 35 | 36 | 35 | 34 | 33 | 32 | 30 | 30 | 31 | 32 | 33 | 33 |
|---|
| Precip. | 15 | 50 | 115 | 140 | 150 | 165 | 100 | 90 | 160 | 125 | 50 | 25 |
|---|
| Prec. days | 2 | 5 | 9 | 10 | 13 | 15 | 11 | 12 | 14 | 13 | 6 | 3 |
|---|
| Humidity | 60% | 61% | 71% | 77% | 80% | 83% | 84% | 84% | 84% | 82% | 81% | 73% |
|---|
| Day length | 12 | 12 | 12 | 12 | 12 | 12 | 12 | 12 | 12 | 12 | 12 | 12 |
|---|
| Sun hours | 7 | 7 | 7 | 7 | 7 | 5 | 4 | 3 | 4 | 6 | 6 | 6 |
|---|
|
See also the
temperatures month by month