Select units of measurement for the temperature and rainfall tables (metric or imperial).
Average weather, temperature, rainfall, sunshine
In Liberia, the climate is
tropical, hot and humid all year round, with a rainy season from May to October due to the African monsoon, and pretty frequent rains in the other months, except in the short dry season that runs from December to February, which is more marked in the north.
Along the coast,
rainfall is very abundant, and exceeds 3,000 millimeters (118 inches) per year. In Monrovia, rainfall reaches as high as 5 meters (16.5 feet) per year. In the interior, precipitation is less abundant, and drops in some areas below 2,000 mm (79 in) per year.
For swimming, the
sea is warm all year round, reaching a minimum of 27 °C (80.5 °F) from July to September.
Liberia is an African country located north of the equator and facing the Atlantic Ocean.
The climate in detail
The seasons
In
winter, from December to February, the rains are rare in the center and north, and the sun frequently shines, although some showers are still possible. The temperature is high, around 30/32 °C (86/90 °F) during the day, and the humidity remains high, especially along the coast and in the forests of the interior.
Sometimes, however, a dry wind able to fill the atmosphere with dust, the
Harmattan, blows from the Saharan desert.
In the inland hilly regions, and especially in the mountain peaks, the highest of which is Mount Wuteve, 1,440 meters (4,724 feet) high, it can sometimes get cool or a bit cold at night.
In
March and April, temperatures slightly rise, and showers become more frequent. Sometimes, it can get very hot, so much so that the temperature can exceed 40 °C (104 °F).
The real
monsoon arrives in May, bringing
torrential rainfall, especially along the coast. From June to October, cloudiness is frequent, and the daytime temperatures drop below 30 °C (86 °F).
Between mid-July and August, the rainy front moves northward, so there is a decrease in rainfall, more evident in the south.
The last month with rainy weather is November, when the rains already decrease sharply compared with the previous months. The temperature increases a little because of the higher amount of sunshine hours, reaching again 30 °C (86 °F) during the day.
Monrovia
 Monrovia
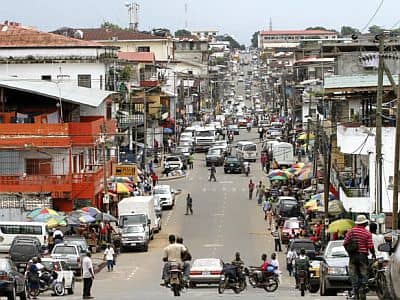
, the capital, is located in the northern part of the coast.
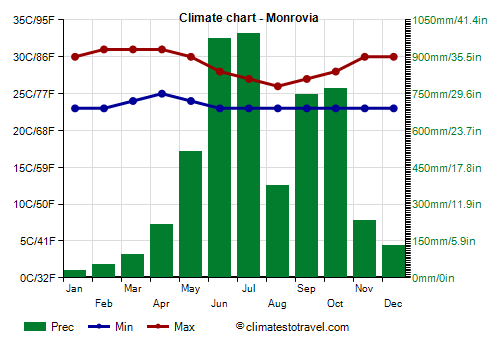
As mentioned, rainfall in Monrovia amounts to 5 meters (200 inches) per year; there's a maximum in June and July, when nearly one meter (3.3 feet) of rain fall per month, and a relative decrease in August. The rains are abundant already in April, and still in November.
In Monrovia, the sky is often cloudy during the rainy season, but the sun does not shine very often even in the (relatively) dry winter season. With 1,660 hours of sunshine annually, Monrovia has as much sunshine as Paris.

Zwedru

In
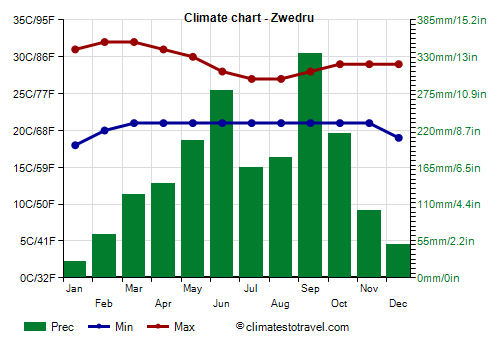
Zwedru, located in the southern inland areas, at 200 meters (650 feet) above sea level, the temperatures are similar to those on the coast, however they are a little lower at night and a little higher during the day.
In Zwedru, rainfall amounts to 1,900 mm (74 in) per year.
When to go
The best time to visit Liberia is
winter, especially in January and February, since they are the sunniest and least rainy months.
The
worst period is from May to October, although, between mid-July and late August, rainfall decreases significantly in the south.
What to pack
In
winter: in Monrovia and the northern coast, bring light clothes for the day, a light sweatshirt for the evening, and a scarf for the wind-borne sand and dust. In Greenville and the south coast, add an umbrella or a light raincoat. In inland areas, it may be useful to bring a sweatshirt and a jacket for the evening.
In
summer: bring tropics-friendly, light clothing of natural fibers, an umbrella (even though it is not useful for the most intense monsoon rains), a light sweatshirt and a light raincoat for the long and heavy downpours. In inland areas and mountain ranges, you can add a heavier sweatshirt for wet and rainy days.
Climate data - Liberia
| Monrovia |
|---|
|
| Jan | Feb | Mar | Apr | May | Jun | Jul | Aug | Sep | Oct | Nov | Dec |
|---|
| Min temp. | 22 | 23 | 24 | 24 | 24 | 23 | 23 | 23 | 23 | 23 | 24 | 22 |
|---|
| Max temp. | 32 | 32 | 32 | 32 | 30 | 28 | 27 | 27 | 28 | 29 | 30 | 30 |
|---|
| Precip. | 30 | 55 | 95 | 215 | 515 | 975 | 995 | 375 | 745 | 770 | 235 | 130 |
|---|
| Prec. days | 4 | 3 | 8 | 12 | 22 | 24 | 21 | 17 | 24 | 22 | 16 | 9 |
|---|
|
|
| Sun hours | 5 | 6 | 6 | 6 | 5 | 4 | 3 | 3 | 3 | 4 | 5 | 5 |
|---|
| Sea temp | 28 | 28 | 28 | 29 | 29 | 28 | 27 | 27 | 27 | 28 | 28 | 29 |
|---|
| Zwedru |
|---|
|
| Jan | Feb | Mar | Apr | May | Jun | Jul | Aug | Sep | Oct | Nov | Dec |
|---|
| Min temp. | 18 | 20 | 21 | 21 | 21 | 21 | 21 | 21 | 21 | 21 | 21 | 19 |
|---|
| Max temp. | 31 | 32 | 32 | 31 | 30 | 28 | 27 | 27 | 28 | 29 | 29 | 29 |
|---|
| Precip. | 25 | 65 | 125 | 140 | 205 | 280 | 165 | 180 | 335 | 215 | 100 | 50 |
|---|
| Prec. days | 2 | 4 | 8 | 11 | 17 | 19 | 18 | 22 | 22 | 17 | 10 | 5 |
|---|
|
|
|
|