Select units of measurement for the temperature and rainfall tables (metric or imperial).
Average weather, temperature, rainfall, sunshine
In Ghana, the climate is
tropical, hot all year round, with a dry season in winter and a rainy season in summer due to the
African monsoon.
Ghana is an African country located south of the Sahara, and facing the Gulf of Guinea in the southern part.
The
rainy season lasts from May to September in the north, from April to October in the center, and from April to November in the south.
On the contrary, in the eastern part of the coast, the rainy season is shorter and goes from April to June, with a
break in July and August, and a slight recovery in September and October.
The
rainiest area is the south, where precipitation is above 1,500 millimeters (60 inches) per year, and even more so the small west coast area, where it reaches 2,000 mm (80 in) per year.
The
driest areas are the north, where the rainfall amounts to around 1,000 mm (40 in) per year, and the eastern coast, which includes Accra, where it drops below 800 mm (31.5 in).
Anyway, as we have said, in the north, there's only one rainy season, which reaches its peak in the summer months, while on the coast, where there is a break in July and August, the rainy season is divided into two.
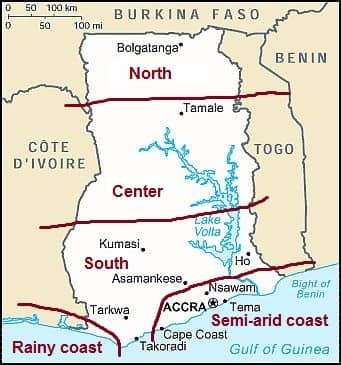
In the following image, we can see the climatic zones of Ghana.
The climate in detail
The center-north
In the center and north,
winter is very hot: daytime temperatures are usually about 35 °C (95 °F) in December and January, even though the air is dry and nights are quite cool. Sometimes, however, nights can get a bit cold in the center-north, with lows dropping to around 10 °C (50 °F).
A dry, dust-laden wind, called
Harmattan, often blows from the desert.
From February to April, the temperature increases further, easily exceeding 40 °C (104 °F) in the north.
But then comes the
monsoon. In March in the center and in April in the north,
early showers and thunderstorms may occur, usually in the afternoon or evening, which become more substantial, exceeding 100 mm (4 in) per month in the following month (ie April in the center and May in the north).
Owing to thunderstorms and clouds brought by the ocean currents, the
temperature gradually decreases, and from July to September, when clouds and rains are more frequent, it drops to around 30/31 °C (86/88 °F), but on the other hand, air humidity increases.
The rains cease in October in the north and in November the center; with the dry wind from the north, hot and sunny conditions return. At the end of the year, rainfall totals 1,000 mm (40 in) in the north and 1,200/1,300 mm (47/51 in) in the center, where, as previously mentioned, the rainy season is longer.
Navrongo
In
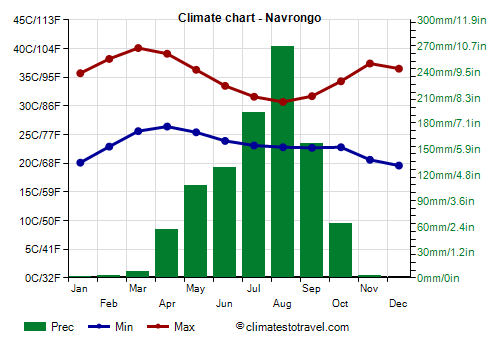
Navrongo, in the far north, highs reach 38/40 °C (100/104 °F) from March to May, while they drop below 31 °C (88 °F) in August.
As mentioned, rainfall in the north amounts to about 1,000 mm (40 in) per year.
The north is the sunniest area of Ghana. The sun often shines in the long dry season, while in the rainy period, the hours of sunshine decrease a bit.
The south
In the
south, the winter is a bit less hot, in fact, the daytime temperatures are about 32/33 °C (90/91 °F) in December and January and reach 34 °C (93 °F) in February. Here, there is almost no warming in spring because the rains begin as early as in March.
Kumasi
For example, in
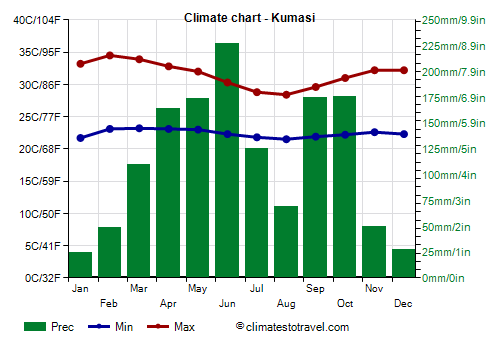
Kumasi, in the south, at 285 meters (935 feet) above sea level, the hottest months are February and March, while the coolest are July and August.
The rainiest month in the south is June (while, as we have seen, in the centre-north it is August). From mid-July to mid-September, the rains decrease a bit, and then they resume from mid-September to early November. In the south, rainfall reaches 1,300/1,400 mm (51/55 in) per year, and even more in some areas to the east of Lake Volta and to the south-west of Kumasi.
In the south, the sun does not shine very often; in fact, even in the short dry period, a bit of cloudiness can form, while from July to September, the sky is normally cloudy.
The coast
Along the coast, the temperature is similar to that of the south, but winter is wetter and night temperatures are higher. Sometimes, however, the dry
Harmattan can arrive even here.
On the coast, as well as in the rest of the country, the summer months are the least hot of the year, though the humidity is high, actually, it is even higher than in inland areas because of the proximity to the sea; on the other hand, the sea breeze blows, reducing the feeling of stuffiness.
As for the
rains, there is a remarkable difference between the western part of the coast, which is very rainy, and the eastern part, where Accra is located, which is much less rainy.
Accra
In
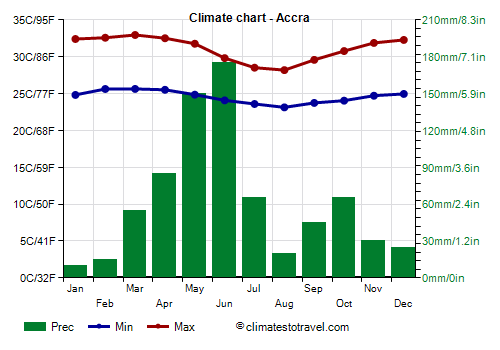
Accra, the capital, the average temperature ranges from 25.7 °C (78.3 °F) in August to 29.3 °C (84.7 °F) in March.
In spring, the first showers occur in March, and peak in June, when precipitation reaches 175 mm (6.9 in) per month. But later, because the so-called "Intertropical Convergence Zone" moves to the north, the rainfall
decreases sharply, so much so that just 20 mm (0.8 in) of rain fall in August. Nevertheless, from June to September, the sky remains usually cloudy.
In September and October, the rains increase again, but they do not reach 100 mm (4 in) per month.
In Accra, only 740 mm (29 in) of rain fall per year, and basically, the only very rainy months are May and June, and sometimes, the first half of July.
In summer, the sky in Accra is often cloudy even in the period when rainfall decreases, from July to September.
The
sea in Ghana is warm enough for swimming all year round, even though the water temperature decreases a little from July to September.
Axim
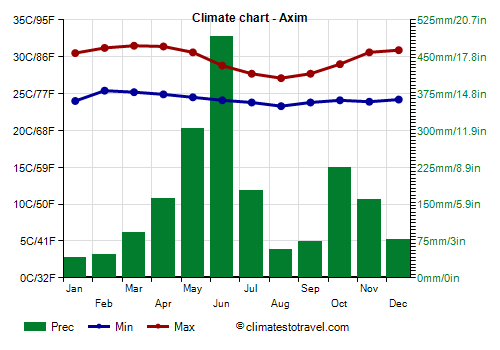
In Axim, on the western part of the coast, temperatures are similar to those in Accra, although they are a little lower because the climate is more humid and rainy, and because it is not affected by the heat island of the big city.
However, as mentioned, in this part of the coast, the rains are
much more abundant, and from May to mid-July, they become really heavy, reaching up to 500 mm (20 in) per month.
The summer break is evident here as well, and runs from mid-July to mid-September, but then the rains return substantial, although they do not reach the peaks of the first part of the rainy season.
The rains linger on until December, so the only relatively dry months here are January and February, in addition to August. In this area, the rainfall can reach 2,000 mm (80 in) per year.
When to go
The best time to visit Ghana is generally the winter, from
December to February, since it is the driest and sunniest period of the year: the weather is generally good, although it's hot during the day in the center-north.
In the
north, the best time is from November to January because in February it gets even hotter. In November, the last rains occur in the south, and even in December on the west coast. So, the best month to visit Ghana as a whole is
January.
What to pack
In
winter: in Accra and the coast, bring light clothes for the day, a light sweatshirt for the evening, and a scarf for the wind-borne sand and dust. In the north, bring light clothing, a sweatshirt and a light jacket for the evening, and a scarf for the desert wind.
In
summer: bring tropics-friendly, light clothing of natural fibers, an umbrella, a light sweatshirt and a light raincoat for the rain showers.
Climate data - Ghana
| Abetifi (595 meters) |
|---|
|
| Jan | Feb | Mar | Apr | May | Jun | Jul | Aug | Sep | Oct | Nov | Dec |
|---|
| Min temp. | 21 | 22 | 22 | 22 | 22 | 21 | 20 | 20 | 20 | 21 | 21 | 22 |
|---|
| Max temp. | 30 | 32 | 31 | 30 | 29 | 28 | 26 | 26 | 27 | 28 | 29 | 29 |
|---|
| Precip. | 20 | 35 | 135 | 140 | 155 | 205 | 95 | 65 | 180 | 175 | 45 | 25 |
|---|
| Prec. days | 1 | 3 | 8 | 10 | 11 | 14 | 8 | 6 | 14 | 13 | 4 | 2 |
|---|
|
|
|
|
| Accra |
|---|
|
| Jan | Feb | Mar | Apr | May | Jun | Jul | Aug | Sep | Oct | Nov | Dec |
|---|
| Min temp. | 25 | 26 | 26 | 26 | 25 | 24 | 24 | 23 | 24 | 24 | 25 | 25 |
|---|
| Max temp. | 32 | 33 | 33 | 33 | 32 | 30 | 29 | 28 | 30 | 31 | 32 | 32 |
|---|
| Precip. | 10 | 15 | 55 | 85 | 150 | 175 | 65 | 20 | 45 | 65 | 30 | 25 |
|---|
| Prec. days | 1 | 1 | 4 | 5 | 8 | 10 | 5 | 4 | 5 | 6 | 3 | 1 |
|---|
| Humidity | 73% | 77% | 77% | 77% | 79% | 83% | 83% | 83% | 82% | 81% | 79% | 76% |
|---|
| Day length | 12 | 12 | 12 | 12 | 12 | 12 | 12 | 12 | 12 | 12 | 12 | 12 |
|---|
| Sun hours | 7 | 7 | 7 | 7 | 7 | 5 | 5 | 5 | 6 | 7 | 8 | 8 |
|---|
| Sea temp | 28 | 28 | 28 | 29 | 29 | 27 | 25 | 24 | 25 | 27 | 28 | 28 |
|---|
| Axim |
|---|
|
| Jan | Feb | Mar | Apr | May | Jun | Jul | Aug | Sep | Oct | Nov | Dec |
|---|
| Min temp. | 24 | 25 | 25 | 25 | 24 | 24 | 24 | 23 | 24 | 24 | 24 | 24 |
|---|
| Max temp. | 30 | 31 | 32 | 31 | 31 | 29 | 28 | 27 | 28 | 29 | 31 | 31 |
|---|
| Precip. | 40 | 50 | 95 | 160 | 305 | 490 | 180 | 60 | 75 | 225 | 160 | 80 |
|---|
| Prec. days | 3 | 4 | 6 | 10 | 15 | 17 | 10 | 8 | 9 | 13 | 11 | 6 |
|---|
|
|
| Sun hours | 6 | 7 | 7 | 7 | 6 | 4 | 4 | 4 | 4 | 6 | 7 | 7 |
|---|
|
| Bole (300 meters) |
|---|
|
| Jan | Feb | Mar | Apr | May | Jun | Jul | Aug | Sep | Oct | Nov | Dec |
|---|
| Min temp. | 18 | 21 | 24 | 24 | 23 | 22 | 22 | 22 | 22 | 22 | 20 | 17 |
|---|
| Max temp. | 36 | 37 | 37 | 35 | 33 | 31 | 30 | 29 | 30 | 32 | 34 | 35 |
|---|
| Precip. | 5 | 15 | 45 | 105 | 130 | 140 | 135 | 155 | 200 | 110 | 20 | 5 |
|---|
| Prec. days | 0 | 1 | 4 | 6 | 8 | 10 | 9 | 10 | 14 | 9 | 2 | 0 |
|---|
|
|
| Sun hours | 8 | 8 | 7 | 8 | 8 | 6 | 5 | 4 | 5 | 7 | 8 | 8 |
|---|
|
| Kete Krachi |
|---|
|
| Jan | Feb | Mar | Apr | May | Jun | Jul | Aug | Sep | Oct | Nov | Dec |
|---|
| Min temp. | 21 | 24 | 26 | 26 | 25 | 24 | 23 | 23 | 23 | 23 | 23 | 21 |
|---|
| Max temp. | 35 | 36 | 36 | 34 | 33 | 31 | 30 | 30 | 31 | 32 | 34 | 34 |
|---|
| Precip. | 10 | 15 | 35 | 105 | 120 | 195 | 220 | 205 | 255 | 155 | 25 | 5 |
|---|
| Prec. days | 0 | 1 | 3 | 6 | 8 | 11 | 11 | 12 | 14 | 10 | 2 | 1 |
|---|
|
|
|
|
| Koforidua |
|---|
|
| Jan | Feb | Mar | Apr | May | Jun | Jul | Aug | Sep | Oct | Nov | Dec |
|---|
| Min temp. | 21 | 23 | 23 | 23 | 23 | 23 | 22 | 22 | 22 | 22 | 22 | 22 |
|---|
| Max temp. | 34 | 35 | 34 | 34 | 33 | 31 | 29 | 29 | 30 | 32 | 33 | 33 |
|---|
| Precip. | 25 | 55 | 115 | 135 | 165 | 195 | 110 | 75 | 145 | 160 | 75 | 30 |
|---|
| Prec. days | 2 | 5 | 8 | 8 | 11 | 12 | 9 | 8 | 12 | 13 | 8 | 3 |
|---|
|
|
| Sun hours | 6 | 7 | 7 | 7 | 7 | 5 | 4 | 3 | 4 | 6 | 7 | 7 |
|---|
|
| Kumasi (285 meters) |
|---|
|
| Jan | Feb | Mar | Apr | May | Jun | Jul | Aug | Sep | Oct | Nov | Dec |
|---|
| Min temp. | 22 | 23 | 23 | 23 | 23 | 22 | 22 | 22 | 22 | 22 | 23 | 22 |
|---|
| Max temp. | 33 | 34 | 34 | 33 | 32 | 30 | 29 | 28 | 30 | 31 | 32 | 32 |
|---|
| Precip. | 25 | 50 | 110 | 165 | 175 | 225 | 125 | 70 | 175 | 175 | 50 | 30 |
|---|
| Prec. days | 1 | 4 | 8 | 10 | 11 | 12 | 8 | 7 | 12 | 13 | 6 | 2 |
|---|
|
|
| Sun hours | 6 | 6 | 6 | 6 | 6 | 5 | 3 | 2 | 3 | 5 | 7 | 6 |
|---|
|
| Navrongo (215 meters) |
|---|
|
| Jan | Feb | Mar | Apr | May | Jun | Jul | Aug | Sep | Oct | Nov | Dec |
|---|
| Min temp. | 20 | 23 | 26 | 26 | 25 | 24 | 23 | 23 | 23 | 23 | 21 | 20 |
|---|
| Max temp. | 36 | 38 | 40 | 39 | 36 | 34 | 32 | 31 | 32 | 34 | 37 | 36 |
|---|
| Precip. | 0 | 5 | 10 | 55 | 110 | 130 | 190 | 270 | 155 | 65 | 0 | 0 |
|---|
| Prec. days | 0 | 0 | 1 | 4 | 6 | 9 | 11 | 15 | 12 | 6 | 0 | 0 |
|---|
|
|
|
|
| Sefwi Bekwai |
|---|
|
| Jan | Feb | Mar | Apr | May | Jun | Jul | Aug | Sep | Oct | Nov | Dec |
|---|
| Min temp. | 22 | 23 | 24 | 24 | 23 | 23 | 23 | 22 | 23 | 23 | 23 | 22 |
|---|
| Max temp. | 34 | 36 | 35 | 34 | 34 | 32 | 30 | 30 | 31 | 32 | 33 | 33 |
|---|
| Precip. | 20 | 55 | 130 | 160 | 185 | 220 | 130 | 80 | 150 | 190 | 95 | 30 |
|---|
| Prec. days | 2 | 4 | 9 | 9 | 12 | 14 | 11 | 9 | 12 | 14 | 8 | 2 |
|---|
|
|
| Sun hours | 6 | 6 | 7 | 7 | 7 | 5 | 4 | 3 | 4 | 6 | 7 | 6 |
|---|
|
| Sunyani (305 meters) |
|---|
|
| Jan | Feb | Mar | Apr | May | Jun | Jul | Aug | Sep | Oct | Nov | Dec |
|---|
| Min temp. | 20 | 22 | 23 | 23 | 22 | 22 | 22 | 21 | 22 | 22 | 22 | 20 |
|---|
| Max temp. | 33 | 35 | 34 | 33 | 32 | 30 | 29 | 28 | 29 | 30 | 32 | 32 |
|---|
| Precip. | 10 | 45 | 90 | 155 | 155 | 180 | 90 | 60 | 165 | 165 | 55 | 10 |
|---|
| Prec. days | 1 | 3 | 6 | 9 | 10 | 12 | 7 | 6 | 12 | 13 | 5 | 1 |
|---|
|
|
|
|
| Takoradi |
|---|
|
| Jan | Feb | Mar | Apr | May | Jun | Jul | Aug | Sep | Oct | Nov | Dec |
|---|
| Min temp. | 23 | 24 | 25 | 25 | 24 | 24 | 23 | 22 | 23 | 23 | 24 | 24 |
|---|
| Max temp. | 31 | 32 | 32 | 32 | 31 | 29 | 28 | 28 | 28 | 30 | 31 | 32 |
|---|
| Precip. | 20 | 30 | 60 | 115 | 220 | 260 | 95 | 40 | 60 | 140 | 65 | 30 |
|---|
| Prec. days | 2 | 3 | 4 | 6 | 11 | 13 | 8 | 6 | 8 | 9 | 5 | 2 |
|---|
|
|
| Sun hours | 6 | 7 | 7 | 7 | 6 | 5 | 5 | 4 | 4 | 7 | 8 | 7 |
|---|
|
| Tamalé |
|---|
|
| Jan | Feb | Mar | Apr | May | Jun | Jul | Aug | Sep | Oct | Nov | Dec |
|---|
| Min temp. | 20 | 23 | 26 | 26 | 25 | 24 | 23 | 23 | 23 | 23 | 22 | 20 |
|---|
| Max temp. | 36 | 38 | 39 | 37 | 35 | 32 | 31 | 30 | 31 | 34 | 36 | 36 |
|---|
| Precip. | 5 | 10 | 35 | 80 | 115 | 140 | 180 | 190 | 205 | 105 | 5 | 5 |
|---|
| Prec. days | 0 | 1 | 2 | 5 | 7 | 10 | 10 | 12 | 14 | 9 | 1 | 0 |
|---|
|
|
| Sun hours | 8 | 8 | 7 | 8 | 8 | 7 | 6 | 5 | 6 | 8 | 9 | 8 |
|---|
|
| Wa (325 meters) |
|---|
|
| Jan | Feb | Mar | Apr | May | Jun | Jul | Aug | Sep | Oct | Nov | Dec |
|---|
| Min temp. | 20 | 23 | 26 | 25 | 24 | 23 | 22 | 22 | 22 | 23 | 22 | 20 |
|---|
| Max temp. | 35 | 37 | 38 | 36 | 34 | 32 | 31 | 30 | 31 | 33 | 36 | 35 |
|---|
| Precip. | 5 | 10 | 20 | 85 | 130 | 140 | 140 | 215 | 200 | 85 | 5 | 0 |
|---|
| Prec. days | 0 | 1 | 2 | 6 | 9 | 9 | 11 | 13 | 14 | 7 | 1 | 0 |
|---|
|
|
| Sun hours | 9 | 9 | 8 | 8 | 8 | 7 | 6 | 5 | 6 | 8 | 9 | 9 |
|---|
|
See also the
temperatures month by month