Select units of measurement for the temperature and rainfall tables (metric or imperial).
Average weather, temperature, rainfall, sunshine hours
Index
Introduction
The climate of Washington State is strongly influenced by the ocean in the western part, while in the eastern part, east of the Cascade Range, it is decidedly more continental and arid.
The climate is cool and humid on the coast, semi-oceanic with quite warm and dry summers on the Puget Sound (see Seattle), and semi-arid continental in the eastern part.
The state of Washington is located in the northwest of the United States, and borders Canada to the north (British Columbia province), and the US states of Idaho to the east and Oregon to the south.
For most of the year, with a maximum between November and March, the state is affected by
disturbances coming from the west after having formed on the Aleutian islands.
In summer, the sub-tropical
high pressure of the Pacific prevails, so there are many sunny days.
Precipitation varies greatly, and at low altitudes, it ranges from 150 millimeters (6 inches) per year in the driest areas of the south-east (see the Hanford site) to 3,000 mm (118 in) west of the Olympic Mountains (see
Forks). In the latter, it even exceeds 6,000 mm (235 in) per year. It follows that there are different types of landscape, since steppes and prairies prevail in inland areas, while vast forests are found in the wet areas of the west. On the mountains, we find instead extensive glaciers.
Coasts
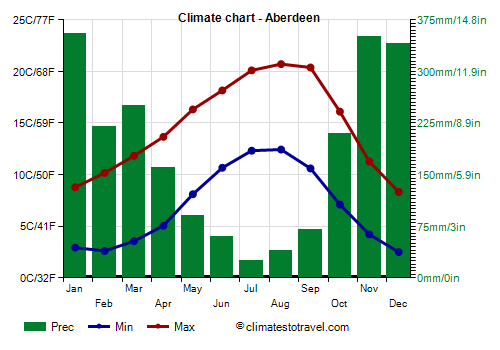
On the west coast, winter is quite mild, while summer temperatures remain cool, with highs reaching around 20 °C (68 °F). In
Aberdeen, located near the coast, the average temperature ranges from 6 °C (43 °F) in January to 16.5 °C (62 °F) in August.
Aberdeen - Average temperatures (1991-2020) |
| Month | Min | Max | Mean |
|---|
| January | 2.9 | 8.8 | 5.9 |
|---|
| February | 2.6 | 10.2 | 6.4 |
|---|
| March | 3.6 | 11.8 | 7.7 |
|---|
| April | 5.1 | 13.7 | 9.4 |
|---|
| May | 8.1 | 16.3 | 12.2 |
|---|
| June | 10.7 | 18.2 | 14.4 |
|---|
| July | 12.3 | 20.1 | 16.2 |
|---|
| August | 12.4 | 20.7 | 16.6 |
|---|
| September | 10.6 | 20.4 | 15.5 |
|---|
| October | 7.1 | 16.1 | 11.6 |
|---|
| November | 4.2 | 11.3 | 7.8 |
|---|
| December | 2.5 | 8.3 | 5.4 |
|---|
| Year | 6.9 | 14.7 | 10.75 |
|---|
On the west coast, rainfall ranges from 1,600 mm (63 in) per year in the southernmost part (see Cape Disappointment), to 1,900/2,000 mm (75/78 in) in the central-northern part, although it reaches 2,500 mm (98 in) per year in the part of the coast to the west of the Olympic Mountains (see
La Push).
In Aberdeen, 2,150 mm (84.5 in) of rain fall per year. The rains are particularly abundant from November to January, while the summer is quite dry.
Aberdeen - Average precipitation| Month | Days |
|---|
| January | 355 | 22 |
|---|
| February | 220 | 19 |
|---|
| March | 250 | 22 |
|---|
| April | 160 | 19 |
|---|
| May | 90 | 14 |
|---|
| June | 60 | 12 |
|---|
| July | 25 | 7 |
|---|
| August | 40 | 7 |
|---|
| September | 70 | 9 |
|---|
| October | 210 | 18 |
|---|
| November | 350 | 22 |
|---|
| December | 340 | 22 |
|---|
| Year | 2155 | 192 |
|---|
The
sea near Aberdeen, as in general on all coasts of the state of Washington (even in the Puget Sound) remains cold even in summer, in fact it doesn't even reach 15 °C (59 °F).
Aberdeen - Sea temperature| Month |
|---|
| January | 9 |
|---|
| February | 9 |
|---|
| March | 9.5 |
|---|
| April | 10 |
|---|
| May | 11.5 |
|---|
| June | 13 |
|---|
| July | 14.5 |
|---|
| August | 14.5 |
|---|
| September | 14.5 |
|---|
| October | 13 |
|---|
| November | 11"> |
|---|
| December | 10 |
|---|
| Year | 11.6 |
|---|
Juan de Fuca
In the northwest, the Strait of
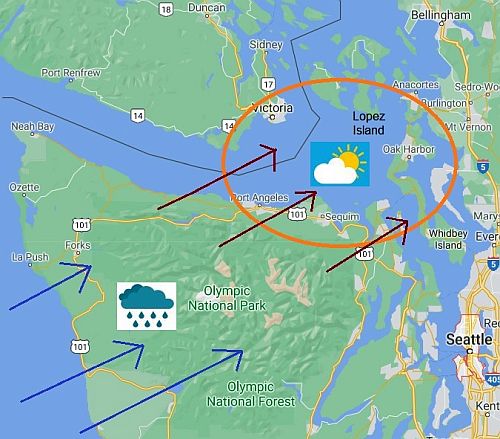
Juan de Fuca, which separates the United States from Canada, is a wet and windy area: Cape Flattery receives 2,000 mm (78 in) of rain per year, and Clallam Bay 2,250 mm (89 in).
But in the central-eastern part of the strait, there's an area that has an
arid and sunny microclimate, being protected by the Olympic Mountains from the prevailing winds that blow from the south-west. In this area, which includes cities such as
Port Angeles,
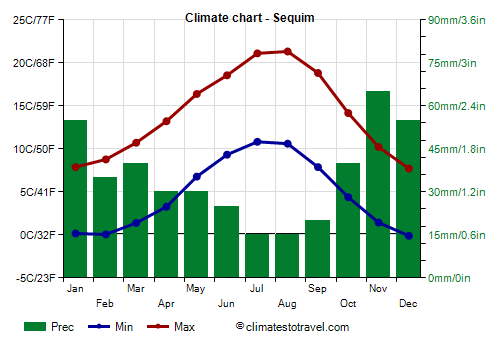
Sequim, Port Townsend and Coupeville, precipitation is below 750 mm (29.5 in) per year, reaching the minimum in Sequim with 425 mm (16.7 in).
Sequim - Average precipitation| Month | Days |
|---|
| January | 55 | 16 |
|---|
| February | 35 | 14 |
|---|
| March | 40 | 14 |
|---|
| April | 30 | 12 |
|---|
| May | 30 | 11 |
|---|
| June | 25 | 9 |
|---|
| July | 15 | 5 |
|---|
| August | 15 | 5 |
|---|
| September | 20 | 9 |
|---|
| October | 40 | 13 |
|---|
| November | 65 | 17 |
|---|
| December | 55 | 17 |
|---|
| Year | 430 | 141 |
|---|
In the central-eastern part of the strait, the climate is slightly more continental than in the western part and on the Pacific coast: night temperatures are lower, while daytime temperatures, especially in summer, are higher. In Sequim, the average temperature ranges from 4 °C (39 °F) in January to 16 °C (61 °F) in July and August.
Sequim - Average temperatures (1991-2020) |
| Month | Min | Max | Mean |
|---|
| January | 0.2 | 7.9 | 4 |
|---|
| February | 0.1 | 8.8 | 4.4 |
|---|
| March | 1.4 | 10.7 | 6.1 |
|---|
| April | 3.3 | 13.2 | 8.2 |
|---|
| May | 6.8 | 16.4 | 11.6 |
|---|
| June | 9.3 | 18.6 | 13.9 |
|---|
| July | 10.8 | 21.1 | 16 |
|---|
| August | 10.6 | 21.3 | 16 |
|---|
| September | 7.9 | 18.8 | 13.4 |
|---|
| October | 4.4 | 14.2 | 9.3 |
|---|
| November | 1.4 | 10.2 | 5.8 |
|---|
| December | -0.1 | 7.7 | 3.8 |
|---|
| Year | 4.7 | 14.1 | 9.4 |
|---|
This area of
rain shadow also affects the southern part of the San Juan Islands (see Lopez and San Juan Island), and the Canadian city of Victoria.
Seattle
The most populated area of the state is the
Puget Sound, a deep fjord extending from north to south, a continuation of the Juan de Fuca strait, where we find cities such as Everett, Seattle, Bellevue, Tacoma, Olympia. Summer is a bit warmer here than in the Juan de Fuca Strait and on the west coast, and sometimes there can be very hot days.
In
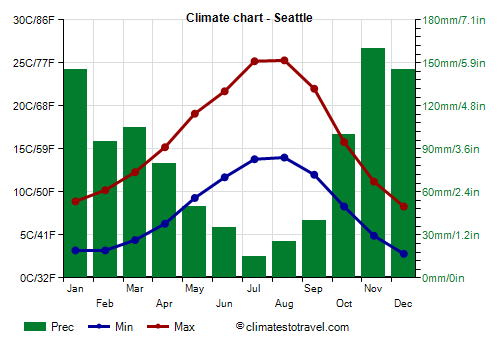
Seattle, the average temperature ranges from 6 °C (43 °F) in January to 19.5 °C (67 °F) in July and August.
Seattle - Average temperatures (1991-2020) |
| Month | Min | Max | Mean |
|---|
| January | 3.2 | 8.9 | 6.1 |
|---|
| February | 3.2 | 10.2 | 6.7 |
|---|
| March | 4.4 | 12.3 | 8.4 |
|---|
| April | 6.3 | 15.2 | 10.8 |
|---|
| May | 9.3 | 19.1 | 14.2 |
|---|
| June | 11.7 | 21.7 | 16.7 |
|---|
| July | 13.8 | 25.2 | 19.5 |
|---|
| August | 14 | 25.3 | 19.6 |
|---|
| September | 12 | 22 | 17 |
|---|
| October | 8.3 | 15.8 | 12 |
|---|
| November | 4.9 | 11.2 | 8 |
|---|
| December | 2.8 | 8.3 | 5.6 |
|---|
| Year | 7.9 | 16.3 | 12.05 |
|---|
This strait is also partially protected by the Olympic Mountains, especially in the north, so that precipitation ranges from 900 mm (35.5 in) per year in Everett, to 950 mm (37.5 in) in Seattle, to 1,300 mm (51 in) in Olympia. Here is the average precipitation in Seattle.
Seattle - Average precipitation| Month | Days |
|---|
| January | 145 | 19 |
|---|
| February | 95 | 16 |
|---|
| March | 105 | 17 |
|---|
| April | 80 | 15 |
|---|
| May | 50 | 11 |
|---|
| June | 35 | 9 |
|---|
| July | 15 | 5 |
|---|
| August | 25 | 5 |
|---|
| September | 40 | 8 |
|---|
| October | 100 | 14 |
|---|
| November | 160 | 18 |
|---|
| December | 145 | 18 |
|---|
| Year | 1000 | 156 |
|---|
Mountains
The Cascade Range runs north to south across the state of Washington and separates the humid part from the arid and continental part. The highest peaks are all active volcanoes: from north to south, Mount Baker, Glacier Peak, Mount Rainier, Mount St. Helens (which erupted in 1980), and Mount Adams.
The aforementioned
Olympic Mountains are located further west, on the Olympic Peninsula, and are not home to volcanoes. Here, the highest peak is Mount Olympus, 2,432 meters (7,979 ft) high. There is also a national park, the
Olympic National Park.
The mountains of Washington State are very humid because they receive the disturbances that arrive most of the year from the ocean. Due to the large amount of
snow that falls, there are vast glaciers and snowfields already at a fairly low altitude (around 1,500 meters or 4,900 feet in the Olympic Mountains, and 1,900 meters or 6,200 feet in the Cascade Range). Snow accumulates until spring and doesn't have time to melt in summer, even if the temperature rises above freezing. However, the glaciers are gradually retreating due to global warming.
Olympic Mountains
On top of
Mount Olympus, which is the wettest being the closest to the ocean, precipitation amounts to a whopping 6,500 mm (255 in) per year, with a maximum of 1,060 mm (41.7 in) in January, and most of it occurs in the form of snow.
Below the limit of perennial snow, rainfall is still very abundant, especially on the western slopes, so much so that there is a temperate rainforest: the
Hoh Rainforest, where it exceeds 3,000 mm (118 in) even at low altitudes, it is the wettest area in the "contiguous" United States.
In Forks too, located west of the forest, rainfall reaches 3,000 mm (118 in) per year.
Mount Rainier
About 100 km (62 mi) south-east of Seattle, we find
Mount Rainier, a volcano, 4,392 meters (14,411 feet) high, which is the highest peak in the state of Washington. It is the snowiest place in the United States, or perhaps in the world (among those where snow is measured regularly): at the
Paradise Ranger Station, 1,650 meters (5,413 ft) above sea level, 17 meters (55.7 feet) of snow fall per year! The volcano is covered with snow and ice from an altitude of about 2,000 meters (6,500 feet).
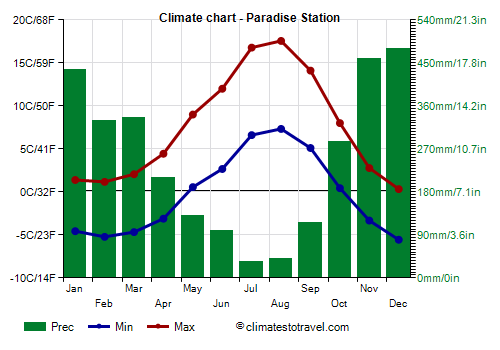
At the Paradise Ranger Station, the average temperature ranges from -2 °C (28.5 °F) in February to 12.5 °C (54.5 °F) in August.
Paradise Station - Average temperatures (1991-2020) |
| Month | Min | Max | Mean |
|---|
| January | -4.6 | 1.4 | -1.6 |
|---|
| February | -5.2 | 1.2 | -2 |
|---|
| March | -4.7 | 2.1 | -1.3 |
|---|
| April | -3.1 | 4.4 | 0.7 |
|---|
| May | 0.6 | 9 | 4.8 |
|---|
| June | 2.7 | 12 | 7.3 |
|---|
| July | 6.6 | 16.8 | 11.7 |
|---|
| August | 7.3 | 17.6 | 12.4 |
|---|
| September | 5.1 | 14.1 | 9.6 |
|---|
| October | 0.4 | 8 | 4.2 |
|---|
| November | -3.3 | 2.8 | -0.3 |
|---|
| December | -5.6 | 0.3 | -2.6 |
|---|
| Year | -0.3 | 7.5 | 3.6 |
|---|
Precipitation amounts to 3,000 mm (118 in) per year, of which, as mentioned, the quantity falling in the form of snow amounts to 17 meters (55.7 feet). Snow normally falls from mid-October to mid-May.
Paradise Station - Average precipitation| Month | Days |
|---|
| January | 435 | 21 |
|---|
| February | 330 | 18 |
|---|
| March | 335 | 22 |
|---|
| April | 210 | 19 |
|---|
| May | 130 | 15 |
|---|
| June | 100 | 13 |
|---|
| July | 35 | 7 |
|---|
| August | 40 | 7 |
|---|
| September | 115 | 10 |
|---|
| October | 285 | 15 |
|---|
| November | 460 | 22 |
|---|
| December | 480 | 21 |
|---|
| Year | 2960 | 189 |
|---|
On top of Mount Rainier, at 4,392 meters (14,411 feet), there is a polar climate, in fact the average temperature ranges from -17.5 °C (0.5 °F) in March to -3 °C (26.5 °F) in August.
Mount Rainier - Average temperatures (1991-2020) |
| Month | Min | Max | Mean |
|---|
| January | -19.4 | -12.7 | -16 |
|---|
| February | -21.4 | -13.1 | -17.2 |
|---|
| March | -22.1 | -12.7 | -17.4 |
|---|
| April | -21.2 | -10.6 | -15.9 |
|---|
| May | -17.4 | -5.7 | -11.5 |
|---|
| June | -14.4 | -2.1 | -8.2 |
|---|
| July | -10.4 | 3.4 | -3.5 |
|---|
| August | -10.1 | 3.6 | -3.2 |
|---|
| September | -11.8 | 1.1 | -5.4 |
|---|
| October | -14.9 | -4.2 | -9.6 |
|---|
| November | -18 | -10.7 | -14.4 |
|---|
| December | -19.7 | -13.2 | -16.4 |
|---|
| Year | -16.7 | -6.4 | -11.5 |
|---|

North-east of Seattle, the
Mount Baker Ski Area is very humid as well, and snowy in the winter months. On Mount Baker, 16.3 meters (641.7 in) of snow fall per year (but in 1998-99, as many as 29 meters or 95 feet fell). The ski season generally runs from late November to late April.
Inland areas
As mentioned, in inland areas, east of the mountains, the climate becomes more
continental and arid. In the central-southern area, along the course of the Columbia River (see Richland, Pasco, Kennewick), where the altitude drops to 200 meters (650 feet) and the rain shadow of the nearby mountains is more effective, annual rainfall drops to 200 mm or 8 inches (therefore at a desert level). Furthermore, the summer in this area is hot, and the hghest records exceed 45 °C (113 °F).

In
Kennewick, located in the southern part of the state and a short distance from the border with Oregon, the average winter temperatures are close to freezing, while the highs in July and August are around 32.5/33 °C (90.5/91.5 °F).
Kennewick - Average temperatures (1991-2020) |
| Month | Min | Max | Mean |
|---|
| January | -1.6 | 5.4 | 1.9 |
|---|
| February | -0.6 | 8.9 | 4.2 |
|---|
| March | 2.2 | 14.5 | 8.3 |
|---|
| April | 5.8 | 19.1 | 12.4 |
|---|
| May | 10.1 | 24.1 | 17.1 |
|---|
| June | 13.6 | 27.8 | 20.7 |
|---|
| July | 16.8 | 32.9 | 24.9 |
|---|
| August | 16.3 | 32.4 | 24.3 |
|---|
| September | 11.8 | 26.9 | 19.4 |
|---|
| October | 6.2 | 18.8 | 12.5 |
|---|
| November | 1.6 | 10.5 | 6.1 |
|---|
| December | -1.3 | 5.3 | 2 |
|---|
| Year | 6.8 | 18.9 | 12.85 |
|---|
Precipitation amounts to just 195 mm (7.7 in) per year.
Kennewick - Average precipitation| Month | Days |
|---|
| January | 29 | 11 |
|---|
| February | 20 | 8 |
|---|
| March | 17 | 8 |
|---|
| April | 15 | 7 |
|---|
| May | 21 | 6 |
|---|
| June | 15 | 5 |
|---|
| July | 5 | 2 |
|---|
| August | 4 | 2 |
|---|
| September | 7 | 3 |
|---|
| October | 17 | 6 |
|---|
| November | 22 | 9 |
|---|
| December | 27 | 10 |
|---|
| Year | 200 | 77 |
|---|
Spokane
In
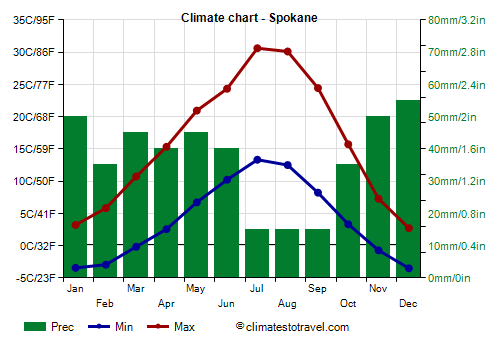
Spokane, located at 600 meters (2,000 ft) above sea level, in the northeastern part of the state and 30 km (18 mi) away from the border with Idaho, the average temperature in December drops below freezing, while the summer highs are around 30/31 °C (86/88 °F).
Spokane - Average temperatures (1991-2020) |
| Month | Min | Max | Mean |
|---|
| January | -3.4 | 3.2 | -0.1 |
|---|
| February | -2.9 | 5.8 | 1.4 |
|---|
| March | -0.2 | 10.7 | 5.3 |
|---|
| April | 2.6 | 15.3 | 8.9 |
|---|
| May | 6.7 | 20.9 | 13.8 |
|---|
| June | 10.2 | 24.3 | 17.3 |
|---|
| July | 13.3 | 30.6 | 22 |
|---|
| August | 12.5 | 30.1 | 21.3 |
|---|
| September | 8.2 | 24.4 | 16.3 |
|---|
| October | 3.3 | 15.7 | 9.5 |
|---|
| November | -0.7 | 7.3 | 3.3 |
|---|
| December | -3.5 | 2.7 | -0.4 |
|---|
| Year | 3.9 | 16 | 9.9 |
|---|
In the eastern part of Washington State, precipitation increase slightly again. In Spokane, it amounts to 440 mm (17.5 in) per year.
Spokane - Average precipitation| Month | Days |
|---|
| January | 50 | 15 |
|---|
| February | 35 | 12 |
|---|
| March | 45 | 13 |
|---|
| April | 40 | 11 |
|---|
| May | 45 | 10 |
|---|
| June | 40 | 9 |
|---|
| July | 15 | 3 |
|---|
| August | 15 | 3 |
|---|
| September | 15 | 5 |
|---|
| October | 35 | 10 |
|---|
| November | 50 | 14 |
|---|
| December | 55 | 14 |
|---|
| Year | 440 | 119 |
|---|
Cold and heat waves
Although it is located west of the Rocky Mountains, and therefore has a milder climate than the interior, Washington State can occasionally experience
polar cold spells, during which the temperature can drop below -20 °C (-4 °F) in inland areas. In this northwestern area of the United States, cold spells sometimes occur early, as early as mid-November (as happened in 1955 and 1985).
For example, in November 1985, the temperature dropped to -24 °C (-11 °F) in Kennewick, -22 °C (-7.5 °F) in Spokane, -18 °C (0 °F) in Olympia, -15 °C (5 °F) in Quillayute, -13 °C (8.5 °F) in Port Angeles and Seattle, and -12 °C (10.5 °F) in Aberdeen.
In February 1989, the temperature dropped to -22 °C (-7.5 °F) in Spokane, -19.5 °C (-3 °F) in Sequim, -16.5 °C (2.5 °F) in Olympia, and -13 °C (8.5 °F) in Aberdeen.
In December 1990, around Christmas, the temperature dropped to -25 °C (-13 °F) in Spokane, -15 °C (5 °F) in Seattle, and -12 °C (10.5 °F) in Quillayute.
The coldest record of Washington State belongs to two towns in the north, Mazama and Winthrop, where on December 30, 1968, the temperature went down to -44 °C (-47 °F).
In summer, on the other hand, there may be
heat waves. In these cases, the highest temperatures are recorded in inland areas at low altitudes.
In June 2015, the temperature reached 44 °C (111 °F) in Kennewick, 43 °C (109.5 °F) in Omak, 42 °C (107.5 °F) in Yakima and Spokane, 36.5 °C (97.5 °F) in Olympia, and 34 °C (93 °F) in Everett.
At the end of June 2021, an exceptional heat wave hit the Northwest of the United States (Pacific Northwest) and the Southwest of Canada. The temperature reached 47 °C (116.5 °F) in Ephrata, 46 °C (115 °F) in Vancouver, Kennewick and Pasco, 45 °C (113 °F) in Spokane, 42 °C (107.5 °F) in Seattle and 38 °C (100.5 °F) in the Juan de Fuca Strait.
The highest record in Washington State is of 48 °C (118.5 °F) and was set at Ice Harbor Dam, a dam on the Snake River, in August 1961, and in Dallesport, in the south on the border with Oregon, at the end of June 2021.
When to go
Along the coast, in Seattle and in the mountains, the best time in Washington State is the summer, as it is the mildest and driest period of the year. In the continental and arid areas of the center-east, since it can be very hot in summer, you can choose the months of May and September.
See also the
temperatures by month.