Select units of measurement for the temperature and rainfall tables (metric or imperial).
Average weather, temperature, rainfall, sunshine hours

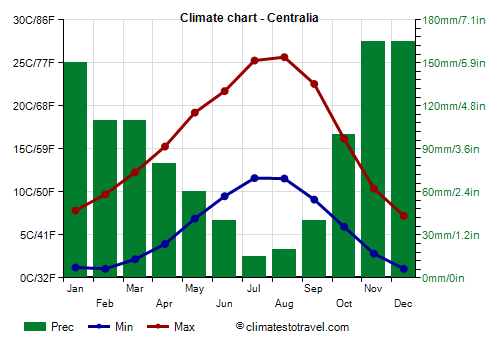
The climate of Centralia is
sub-oceanic, with quite cold, rainy winters and mild, fairly sunny summers.
The city is located in the southwest of
Washington state, at sea level, 85 km (52 mi) away from the sea.
Fog can form at night, especially from October to March.
Although the
winter is not very cold, every winter there can be a cold period, with night lows of -6/-7 °C (19/21 °F). Moreover, there can sometimes be cold waves, sometimes even in November, with night temperatures going down to -15 °C (5 °F) or even below. In December 1978 and February 1989, it dropped to -18 °C (0 °F).
Snow is quite rare, but given the high precipitation level, a heavy snowfall can occasionally occur. On average, 17 cm (7 inches) of snow fall per year.
In
summer, nights are cool, and sometimes even a little cold, while the days are generally pleasant. However, it can sometimes get hot, and on the hottest days of the year, it can reach 35/36 °C (95/97 °F). In July 2009, it reached 41 °C (106 °F), while in late June 2021, it reached 42 °C (107 °F).

Best Time
The best time to visit Centralia is summer, especially in July and August, since it is the mildest, driest and sunniest period of the year. May, June and September are also acceptable months.
Centralia - Climate data
In Centralia, the
average temperature of the coldest month (December) is of
4.1 °C, that of the warmest month (August) is of
18.6 °C. Here are the average temperatures.
Centralia - Average temperatures (1991-2020) |
| Month | Min | Max | Mean |
|---|
| January | 1.2 | 7.8 | 4.5 |
|---|
| February | 1.1 | 9.7 | 5.4 |
|---|
| March | 2.2 | 12.3 | 7.2 |
|---|
| April | 3.9 | 15.3 | 9.6 |
|---|
| May | 6.9 | 19.2 | 13.1 |
|---|
| June | 9.5 | 21.7 | 15.6 |
|---|
| July | 11.6 | 25.3 | 18.4 |
|---|
| August | 11.6 | 25.7 | 18.6 |
|---|
| September | 9.1 | 22.6 | 15.8 |
|---|
| October | 5.9 | 16.2 | 11.1 |
|---|
| November | 2.8 | 10.4 | 6.6 |
|---|
| December | 1.1 | 7.2 | 4.1 |
|---|
| Year | 5.6 | 16.1 | 10.85 |
|---|
amounts to
1055 millimeters per year: it is therefore quite abundant. It ranges from
15 millimeters in the driest month (July) to
165 millimeters in the wettest ones (November, December) Here is the average precipitation.
Centralia - Average precipitation| Month | Days |
|---|
| January | 150 | 22 |
|---|
| February | 110 | 18 |
|---|
| March | 110 | 20 |
|---|
| April | 80 | 17 |
|---|
| May | 60 | 12 |
|---|
| June | 40 | 9 |
|---|
| July | 15 | 4 |
|---|
| August | 20 | 5 |
|---|
| September | 40 | 8 |
|---|
| October | 100 | 16 |
|---|
| November | 165 | 21 |
|---|
| December | 165 | 22 |
|---|
| Year | 1055 | 172 |
|---|