Select units of measurement for the temperature and rainfall tables (metric or imperial).
Average weather, temperature, rainfall, sunshine hours

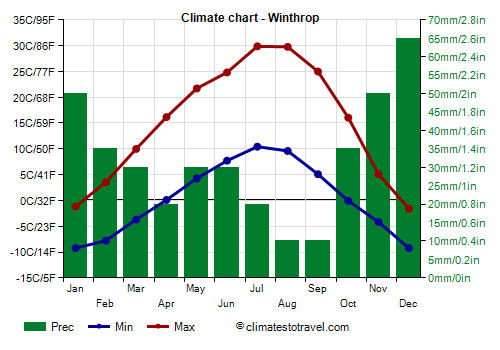
The climate of Winthrop is
arid continental, with very cold winters and hot summers, and with strong temperature variations between night and day.
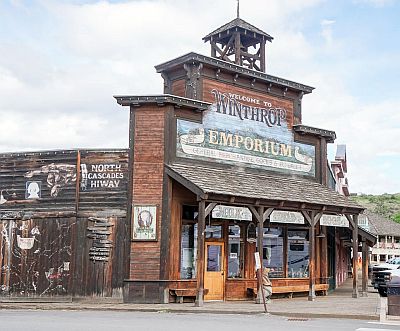
The town, which has a few hundred inhabitants, has the appearance of an old West city. It is located in the north of
Washington state, east of the Cascade Range, in a valley at 600 meters (2,000 ft) above sea level. In the area, you can practice cross-country skiing.
During the
winter, sometimes as early as in mid-November, cold spells can occur, in which the temperature drops to -30 °C (-22 °F) or below. Together with Mazama (located 27 kilometers or 17 miles northwest), Winthrop holds the coldest record for the state of Washington: -44 °C, recorded on December 30, 1968.
On average, 150 cm (59 in) of snow fall per year.
In
summer, the temperature range between night and day is high, so it can get cold at night, while during some periods, it can reach 38/40 °C (100/104 °F) during the day. During the exceptional heat wave of late June 2021, it reached 42.8 (109 °F).

Best Time
The best times to visit Winthrop are spring and autumn, and in particular the months of May and September, to avoid both the winter cold and the summer heat.
Winthrop - Climate data
In Winthrop, the
average temperature of the coldest month (December) is of
-5.4 °C, that of the warmest month (July) is of
20.2 °C. Here are the average temperatures.
Winthrop - Average temperatures (1991-2020) |
| Month | Min | Max | Mean |
|---|
| January | -9.2 | -1.2 | -5.2 |
|---|
| February | -7.8 | 3.6 | -2.1 |
|---|
| March | -3.7 | 10 | 3.2 |
|---|
| April | 0.1 | 16.2 | 8.1 |
|---|
| May | 4.3 | 21.7 | 13 |
|---|
| June | 7.7 | 24.8 | 16.3 |
|---|
| July | 10.4 | 29.9 | 20.2 |
|---|
| August | 9.6 | 29.8 | 19.7 |
|---|
| September | 5.1 | 25 | 15.1 |
|---|
| October | -0.1 | 16.1 | 8 |
|---|
| November | -4.2 | 5.1 | 0.5 |
|---|
| December | -9.2 | -1.6 | -5.4 |
|---|
| Year | 0.3 | 15 | 7.65 |
|---|
amounts to
385 millimeters per year: it is therefore quite scarce. It ranges from
10 millimeters in the driest months (August, September) to
65 millimeters in the wettest one (December). Here is the average precipitation.
Winthrop - Average precipitation| Month | Days |
|---|
| January | 50 | 12 |
|---|
| February | 35 | 9 |
|---|
| March | 30 | 8 |
|---|
| April | 20 | 6 |
|---|
| May | 30 | 8 |
|---|
| June | 30 | 7 |
|---|
| July | 20 | 4 |
|---|
| August | 10 | 4 |
|---|
| September | 10 | 4 |
|---|
| October | 35 | 8 |
|---|
| November | 50 | 12 |
|---|
| December | 65 | 13 |
|---|
| Year | 385 | 97 |
|---|