Select units of measurement for the temperature and rainfall tables (metric or imperial).
Average weather, temperature, rainfall, sunshine hours

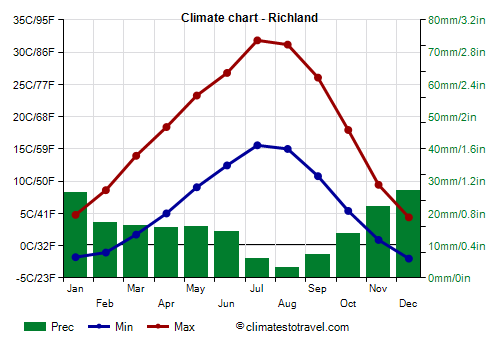
The climate of Richland is
arid continental, with cold, relatively rainy winters and hot, sunny summers.
The city is part, together with
Kennewick and
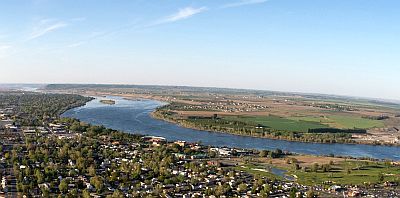
Pasco, of the so-called Tri-Cities, three cities connected to each other at the confluence of the Yakima, Snake and Columbia rivers. We are in the eastern part of the state of
Washington. Since we are practically at sea level and far from the ocean, this is one of the driest areas of the state, and one of the hottest in summer.
In
winter, sometimes even in November, cold waves are possible, during which the temperature can drop to -20 °C (-4 °F) or even below. In the nearby airport of Pasco Tri-Cities, the temperature dropped to -24 °C (-11 °F) in November 1985, -22.7 °C (-9 °F) in December 1990, -26.7 °C (-16 °F) in December 1996, -28.3 °C (-19 °F) in January 2004, and -23 °C (-9.5 °F) in December 2016.
Snowfall is quite frequent, but generally not abundant. On average, only 15 cm (6 in) of snow fall per year.
In
summer, there are several very hot days. On the hottest days of the year, the temperature generally reaches 39/40 °C (102/104 °F), but sometimes even higher. During the exceptional heat wave of late June 2021, it reached 46 (115 °F). In August 1961, at the nearby Ice Harbor Dam, a dam on the Snake River, the highest record of Washington state was set with 48 °C (118 °F).

Best Time
The best times to visit Richland are spring and autumn, and in particular the months of May and September, to avoid both the winter cold and the summer heat.
Richland - Climate data
In Richland, the
average temperature of the coldest month (December) is of
1.2 °C, that of the warmest month (July) is of
23.7 °C. Here are the average temperatures.
Richland - Average temperatures (1991-2020) |
| Month | Min | Max | Mean |
|---|
| January | -1.8 | 4.8 | 1.5 |
|---|
| February | -1.1 | 8.6 | 3.8 |
|---|
| March | 1.7 | 13.9 | 7.8 |
|---|
| April | 5 | 18.4 | 11.7 |
|---|
| May | 9.1 | 23.3 | 16.2 |
|---|
| June | 12.4 | 26.8 | 19.6 |
|---|
| July | 15.6 | 31.8 | 23.7 |
|---|
| August | 15 | 31.2 | 23.1 |
|---|
| September | 10.8 | 26.1 | 18.4 |
|---|
| October | 5.4 | 17.9 | 11.7 |
|---|
| November | 0.9 | 9.4 | 5.2 |
|---|
| December | -2 | 4.4 | 1.2 |
|---|
| Year | 6 | 18.1 | 12 |
|---|
amounts to
185 millimeters per year: it is therefore at a desert level. It ranges from
3.3 millimeters in the driest month (August) to
27.2 millimeters in the wettest one (December). Here is the average precipitation.
Richland - Average precipitation| Month | Days |
|---|
| January | 26 | 12 |
|---|
| February | 17 | 9 |
|---|
| March | 16 | 8 |
|---|
| April | 16 | 7 |
|---|
| May | 16 | 7 |
|---|
| June | 14 | 5 |
|---|
| July | 6 | 2 |
|---|
| August | 3 | 2 |
|---|
| September | 7 | 3 |
|---|
| October | 14 | 7 |
|---|
| November | 22 | 10 |
|---|
| December | 27 | 12 |
|---|
| Year | 185 | 84 |
|---|